Australia’s birth rate lowest on record, but more babies than ever
So the headline is, in 2018, Australia’s birth rate fell to an all-time low of 1.740 babies per female of childbearing age.
What is the birth rate?
The birth rate (or technically, Total Fertility Rate (TFR)), represents the total number of babies a woman could expect to have, if the age-specific fertility rates for that year persisted through her lifetime. Of course, it’s an average, and hopefully, no-one actually has 1.740 babies. While it’s an all-time low, it’s only 0.001 lower than the previous year.
The ABS has recently released new data on the number of births in Australia. These are normally about a year after the time period concerned, mainly due to delays in registering births at the end of the year. So these relate to the 2018 calendar year. You can find all the details in Births, Australia, 2018 (3301.0).
The birth rate has fallen from the recent peak of 2.02 in 2008, which was the height of the post-millennial “baby blip” driven by a generation of women starting to have children a bit earlier in life again, and at a time when we also had the “baby bonus” financial incentive for having children. That peak was very close to “replacement level”, generally seen as slightly over 2 (ie. replacing Mum and Dad, with a small factor for infant mortality).
Where does the term baby boomer come from?
This chart is one of my favourites on the ABS website (annotations are mine) – it shows the changing birth rates over the past 70 years. A lot of people forget where we get the term “baby boomer” – it comes from the huge baby boom which happened around the end of World War II, until the introduction of the contraceptive pill in the early 1960s.
Total fertility rate, 1934 to 2018
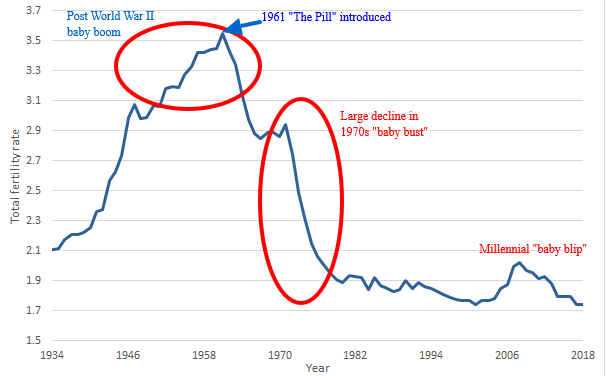
Source: ABS 3301.0 Births, Australia, 2018 (annotations by .id)
The birth rate was much higher in the 1950s, and indeed much higher continually throughout the past in Australia – 2018 sees the lowest fertility rate ever recorded. And yet, at the same time, there are more births in the country than ever before! Why is this? Well, it’s simply due to population growth – our population increases through a combination of migration and natural increase (with the majority due to migration). So, despite a lower rate, there are now more people around to have children, so there is a higher number of babies being born in total.
In 2018, 315,747 births were registered in Australia, about 6,000 more (or a 2% increase) from 2017. So although the birth rate is falling, we are at the moment getting a record number of births every year. This contrasts to the 1970s when we didn’t have such strong population growth, and the birth rate was falling by a large amount each year – 1979 had 50,000 fewer births than 1971.

What is the average age at which Australians are having children?
The average age at which we have children continues to increase as well. Across all births, the average age of mothers was 31.4 years, while fathers were 33.5 years. During the 1960s, mothers were much younger, around 26-27 being the average (and they had more children as well).
Median age of parents, 1933 to 2018
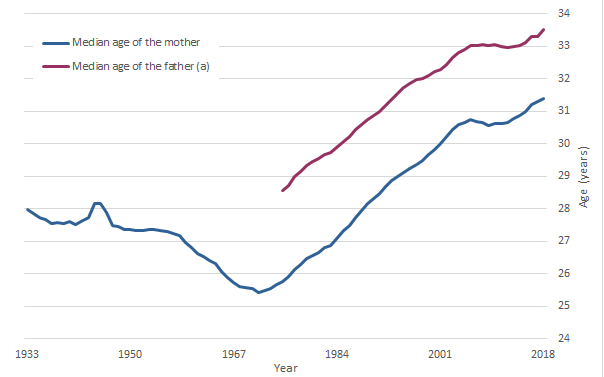
Source: ABS 3301.0 Births, Australia, 2018
This chart shows that the median age of mothers dipped a little during the baby blip, but has continued its upward trajectory which has been happening since the late 1960s.
The birth rate also varies a lot between the states and territories. Northern Territory consistently has the highest rate, and increasing in the last year, along with NSW. The largest decline was in Victoria, which now has the lowest fertility rate of any state, at 1.598 (the ACT is marginally lower, at 1.547).
Total Fertility Rate, States and Australia, 2008, 2017, 2018
Source: ABS 3301.0 Births, Australia, 2018
These birth rates are also available for smaller areas – and form a key component of our population forecasts. Generally, fringe metropolitan growth areas have high fertility rates, along with rural areas, while inner-city areas tend to be lower. You can also see the birth rates on forecast.id for each suburb within your area, for those councils who subscribe to this tool.
Glenn Capuano - Census Expert
Glenn is our resident Census expert. After ten years working at the ABS, Glenn's deep knowledge of the Census has been a crucial input in the development of our community profiles. These tools help everyday people uncover the rich and important stories about our communities that are often hidden deep in the Census data. Glenn is also our most prolific blogger - if you're reading this, you've just finished reading one of his blogs. Take a quick look at the front page of our blog and you'll no doubt find more of Glenn's latest work. As a client manager, Glenn travels the country giving sought-after briefings to councils and communities (these are also great opportunities for Glenn to tend to his rankings in Geolocation games such as Munzee and Geocaching).


