Top 5 questions from the webinar: ‘How COVID-19 is shaping population growth across Australia?’
So many questions… so little time
In case you missed it, a few weeks ago Katie Bayley and Andrew Rossiter from our Local Government population forecasting team held a free lunchtime webinar on how the pandemic is shaping population growth around Australia.
Bringing together insights from a three-part blog series, Katie and Andrew dived deeper into how the early stages of COVID-19 is impacting different ‘types of places’ within our Capital Cities as well as within Regional Australia.
We were overwhelmed with the turnout. With around 500 registrations and a flood of questions in the Q&A chat, we weren’t able to respond to everyone on the day.
In this blog Andrew answers the top five most asked questions from the webinar, and if you missed it, you can register here to download the full recording.
1. How did you come up with typologies?
How we came up with the ‘types of place’ framework, or typologies, was the most asked question from the webinar.
Essentially we use typologies to classify areas by their predominant role and function. So, is an area CBD/Inner city, suburban or growth? In Regional Australia, is it a major regional city, rural or coastal?
Understanding the different dynamics of places is part-and-parcel of our day-to-day forecasting work at a small area level. However, in the early stages of the pandemic there was an immediate need to quickly understand how population growth in different Local Government Areas would likely be impacted. We knew that similar types of places would be facing the same challenges. For example, CBD and Inner city areas, which typically attract large numbers of overseas migrants would be impacted hard by national border closures.
And the key word here is predominant, so where most residents live, which meant that we often just needed to make a call.
If you are interested to know where your Council fits into this framework, you can read more on our typology framework here which includes links to past blogs listing all Council areas by typology.
2. Were any typologies controversial?
We were also asked lots of questions about how we defined the major regional city typology. Questions like, ‘is Orange a major regional city?’, and ‘where does Coffs Harbour fall as it’s a large regional city, but also a coastal area?’.
For the purpose of the COVID-19 impact assessment, we defined a major regional city as any non-capital city with over 50,000 residents. Why 50,000? There is no right or wrong answer, but we feel that generally, these are the number of residents needed to generate the range of higher-order services, facilities and employment to extend to, and support communities far and wide beyond the city itself.
Other characteristics we identified as common to major regional cities include a Central Business District (CBD), rail, ports, airports, as well as suburbs which are often in different life-cycle stages.
We felt that cities with these characteristics often face similar challenges and opportunities. For example, the higher-order services and employment opportunities typically attract larger numbers of overseas migrants than other regional areas, which would likely be more negatively impacted by border closures.
If you are interested to know more about major regional cities including our early thinking on current population dynamics you can read more here Major regional cities.
3. What’s causing the demand if no one is coming?
A key theme from the webinar was the impact that the early stages of the pandemic had on migration. We explored what the first few months of the pandemic meant – essentially that fewer people moved both to and from Australia (but also within Australia). Although we were asked about the impact of border closures on overseas migration, we were actually asked more questions about internal migration, with the three main questions being:
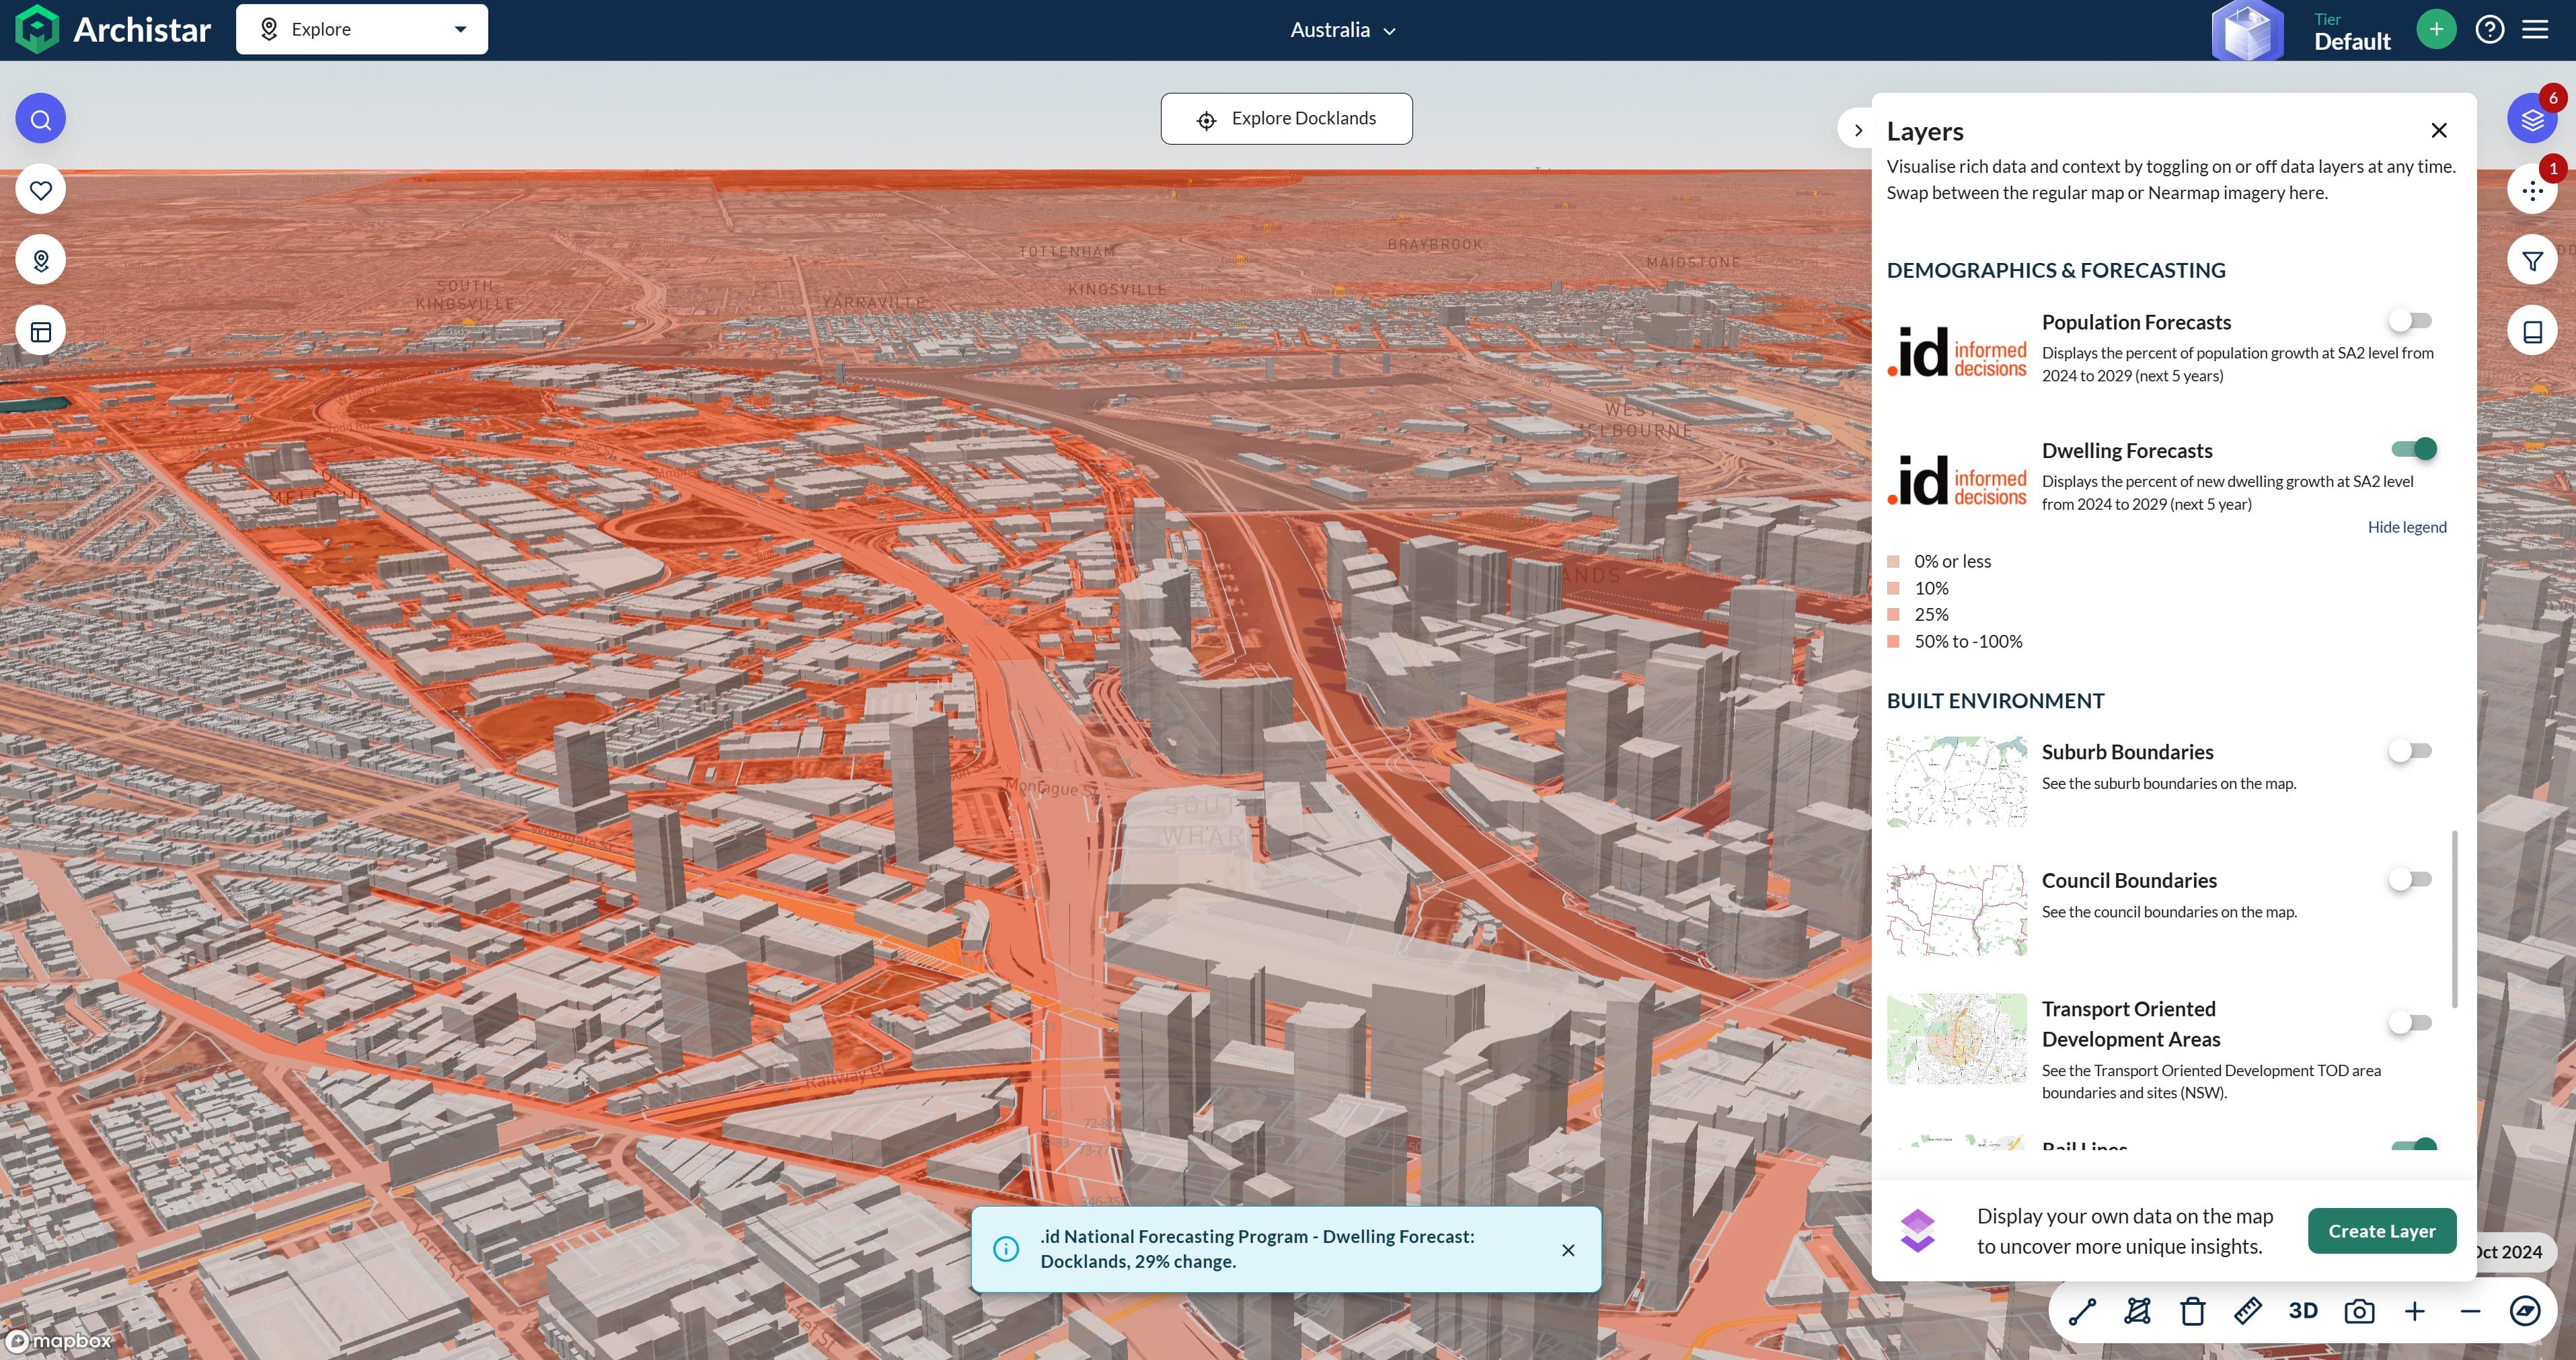
Q: ‘Is Perth and Adelaide’s growth due to internal migration from other major cities such as Melbourne and Sydney?’
A: Yes, much of the increases in growth in Perth and Adelaide is from net migration to/from the eastern capital cities. But the key word here is ‘net’, so it is also important to consider people leaving Perth and Adelaide.
The chart below shows the ABS’ migration estimates for Perth. It’s a handy direct comparison of the first three months of COVID-19 as it compares the June quarter 2020 to the same period in 2019.
It shows the biggest change was to/from Melbourne, with Perth significantly reducing its recent net losses. Digging into the data shows that this change was caused more by fewer people leaving Perth for Melbourne (820 fewer people), rather than attracting people from Melbourne (170 fewer people).
There was also a reduction in net losses to Brisbane.
Oh, and you’ll also notice a small decline to/from regional WA, as the Coastal areas of Port Hedland, Denmark, Greater Geraldton and Bunbury turned around their recent fortunes.
Net internal migration (gain/loss), Perth, June qtr 2019 & June qtr 2020
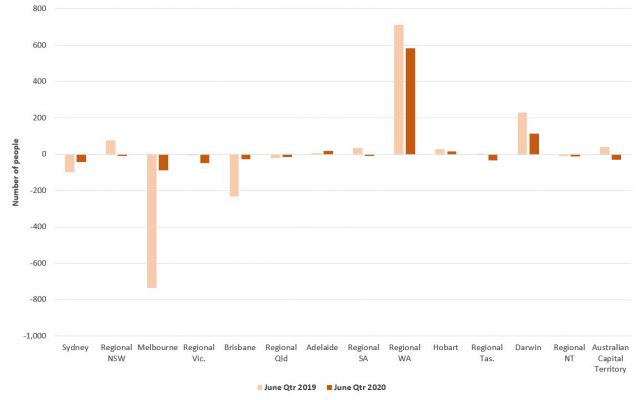
In Adelaide, the impact on migration to/from Melbourne was almost identical, with far fewer departures to Melbourne than arrivals recorded.
What is interesting here is the net gain from Sydney, which was driven mostly by fewer departures from Adelaide, but also an uptick in people moving from Sydney.
Net internal migration (gain/loss), Adelaide, June qtr 2019 & June qtr 2020
And a heads up. There are more green shoots with the latest December 2020 quarterly estimates from the ABS showing an increase in arrivals in Perth and Adelaide… And this leading dataset shows WA is experiencing large increases in vehicle and licence transfers from the Eastern States, with vehicle transfers up by more than 10,000 in the year to April 2021.
We’ll keep watching this space.
Q: ‘Is Melbourne experiencing a larger exodus given the lock downs?’
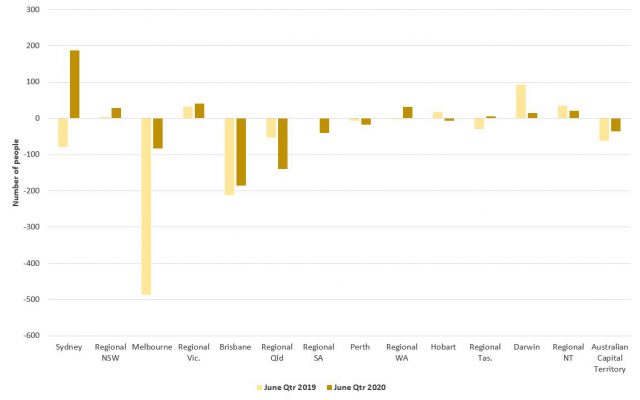
A: There has been a lot of commentary about the exodus of people moving from our Capital Cities to regional Australia, particularly from Melbournbe.
So what do the official estimates show? Just over 25,000 people left Melbourne in the first three months of COVID-19 (June qtr 2020).
The chart below shows that this is undoubtedly high compared to the past 20 years, although it was actually beaten recently in December qtr 2018 (over 26,500 departures) and December qtr 2017 (over 25,200 departures).
And the latest ABS estimates are that 28,400 people left Melbourne in the three months to December 2020. Exodus levels? You be the judge.
Estimated resident departures, Melbourne, Sept qtr 2001 & June qtr 2020
Q: ‘What about regional Australia? You mentioned Regional Tasmania? Regional Queensland is feeling it too…’
A: What is perhaps more telling is just how many people did not move from regional Australia to Capital Cities. Typically, large numbers of young adults move from rural and coastal areas, and this just did not happen as much in the first few months of the pandemic.
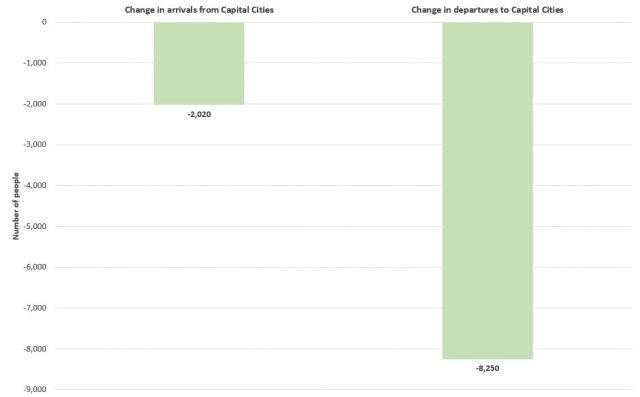
The chart below shows that 8,250 fewer people moved from regional Australia to Capital Cities in the June qtr 2020, compared to the same period in 2019. It also shows that over the same period, 2,000 fewer people moved from Capital Cities to regional Australia.
That’s right, fewer people actually moved from Capital Cities to regional Australia! So the growth in regional Australia is mostly down to the regions retaining more people.
The typologies where we noticed this trend the most were:
- Queensland, Major regional cities of Townsville, Rockhampton and Mackay. Coastal areas of Livingstone and Whitsunday, and Rural areas including Mount Isa and Issac
- Tasmania, Rural areas of Brighton, Meander Valley, West Tamar Dorset and Georgetown
- New South Wales, Major regional cities of Greater Newcastle (Newcastle and Lake Macquarie in particular) and Coastal areas including Eurododalla and Port Stephens.
Change in arrivals and departures, Regional Australia, June qtr 2019, June qtr 2020
4. What are the implications on housing?
Leading on from this we were asked about implications of shifts in population growth on housing. We were asked, ‘how can this regional growth continue to be supported with available housing, infrastructure, amenities and employment?’
This excellent question highlights the impact that sudden shifts in historic population trends have on planning for adequate housing availability, infrastructure and a whole host of facilities and services. Over the past year, we have seen first-hand how this increased regional demand is translating into housing availability and cost pressures in many regional areas.
In his blog Housing affordability in Regional Australia last week, my colleague Nenad addresses this very point. He looks at the factors influencing regional house pricing and affordability, as well as the levers Local Government have to affect affordability in their local areas. He also explains why housing affordability in regional Australia really matters with regard to an area’s ability to attract key workers as well as retaining local residents and their connectedness to their communities.
As population forecasters, we are asking ourselves ‘how long is this trend likely to continue?’ so we can provide the evidence base to support ongoing planning.
5. How are you using this data in your forecasts?
Finally, we were asked lots of questions about how we are factoring these learnings into our forecasts. Questions like, ‘Are you expecting a delayed demographic impact in Growth areas’, ‘What are some likely implications for long-term work from anywhere practices?’ and ‘When do you expect these trends to reverse (if at all)?’.
It goes without saying that the past year has been a massive one when it comes to local area population forecasting and we’ve been sharing our thinking and our learnings with clients along the way.
The latest Estimated Resident Population (ERP) data has given us the confidence that our typology assumptions are reflective of the (continually) evolving situation; as well as assurance that the forecasts for many of our Local Government clients are tracking well.
This information has also been incorporated into our annual forecast.id monitoring process and informed our understanding of which councils have had the most significant impact to their population growth. Broadly speaking we are working to adjust the forecasts of those councils being impacted now; predominantly CBD and Inner city councils.
We are also using the typology framework as a guide to adjust our forecast assumptions at a small area level. For example, in many CBD and Inner city areas, we are reflecting more unoccupied dwellings and vacancies within student accommodation. In growth areas, we are reflecting short-term pent up demand for dwellings, followed by delayed dampened demand.
Of course in regional Australia, we are seeing coastal areas with holiday homes as popular places to live now.
We are also looking forward to the 2021 Census in August which will provide us with the best data to check our forecasting assumptions and recalibrate our forecasts! What a Census it will be!
Andrew Rossiter
Andrew’s background is in urban economics with a focus on urban productivity, regeneration, and strategic land-use planning. Andrew works together with our local government clients to develop and monitor population forecasts, and is currently developing forecast.id’s monitoring process. His background in consulting and economics has developed his ability to draw out the policy implications of population forecasts, and understand and communicate the macro influences on demographic change.