Can current rates of housing development be sustained?
As forecasters, we’re currently confronted by a strange set of circumstances. Based on what we know of population change in the next few years, demand for dwellings is likely to slow considerably. However, many fringe areas of Australia are seeing significant sales and construction of residential lots.
This blog shares analysis from our upcoming eBook ‘ Demographic delays: how closed borders will impact future demand for services’ .
The eBook will explore how the demographic fallout of border closures affects utilities, retailers, and other organisations who need to plan services for our cities, established suburbs, and growth areas.
You can now pre-register for a copy of that eBook here.
Why this has come to our attention
We’re seeing this issue because we take a unique approach to population forecasting.
Our small area forecasts (SAFi) use a top-down constraint. In simple terms, this means we look at the national and state-level population numbers (which we’ve adjusted for the impacts of COVID-19), and use our knowledge of demographic patterns, land use, and housing at a highly localised level to determine how that total population is likely to be distributed around the country in the years ahead.
It’s because we have built this combined view (top-down and bottom-up) that we’re seeing the strange situation where residential development on our fringes is surging ahead, yet the pipeline of demand for housing that comes from population growth at a national level, is slowing to a trickle.
We don’t know of any other Australian forecasters who are doing this work, where the granular, local area forecasts must add up to a national total, which may be why we’re not seeing this story reported more widely.
A key assumption vindicated
On March 18th, the ABS released Net Overseas Migration (NOM) data for the September quarter of 2020, which showed the assumptions we’d made for NOM in 2020-21 (assumptions that had seemed rather dramatic at the time) to be quite reasonable.
Net Overseas Migration is the net gain or loss of population through immigration to Australia and emigration from Australia. It has been the biggest driver of population growth in Australia since 2005, and therefore a very important factor in forecasting the total population of Australia in the years ahead.
We knew the closing of Australia’s borders would have a significant negative impact on NOM, but we turned to an authority closer to that decision to determine exactly how big that impact would be.
Our Covid-adjusted forecasts use the same short term NOM assumptions as the Centre for Population , whose forecasts were released with the Federal Budget papers last year, and who, as a part of Federal Treasury, have access to detailed Net Overseas Migration statistics from the Department of Home Affairs (prepared by the ABS) – a reliable view of future overseas migration.
These assumptions show a 300,000 person net turnaround in NOM in the 2020-21 financial year, compared to the pre-covid ‘baseline’ forecast (and ten years of historically high rates of Net Overseas Migration).
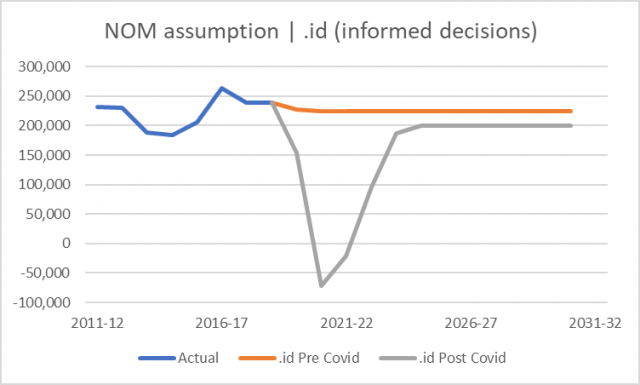
When the Treasury released this figure of -70,000 NOM forecast in 2020-21 as a part of last year’s federal budget, even in such strange times, it seemed somewhat radical given we have maintained such a high level of NOM for so long.
The recent data from the ABS was a chance to see if those assumptions were reasonable. It showed that in a single quarter we saw -34,000 NOM. This was for just the first quarter of 2020-21; a quarter that has historically been one of the strongest for overseas migration to Australia.
Suddenly, the assumption that NOM would fall to -70,000 over the four quarters to June 2021 looks entirely feasible, if not a little conservative.
A discrepancy emerging
So, if we now accept that the NOM assumptions underpinning the national population forecasts are reasonable, there’s a curious discrepancy emerging.
We’re continuing to see a strong pipeline of development, particularly on the fringes of our growth areas, that are either being built or in the pipeline to be built.
The following cadastral map shows recent subdivision registrations in the Melton growth corridor in Melbourne’s West (new subdivision since February 2020; red, approved in the last year; blue, in the last three months!).
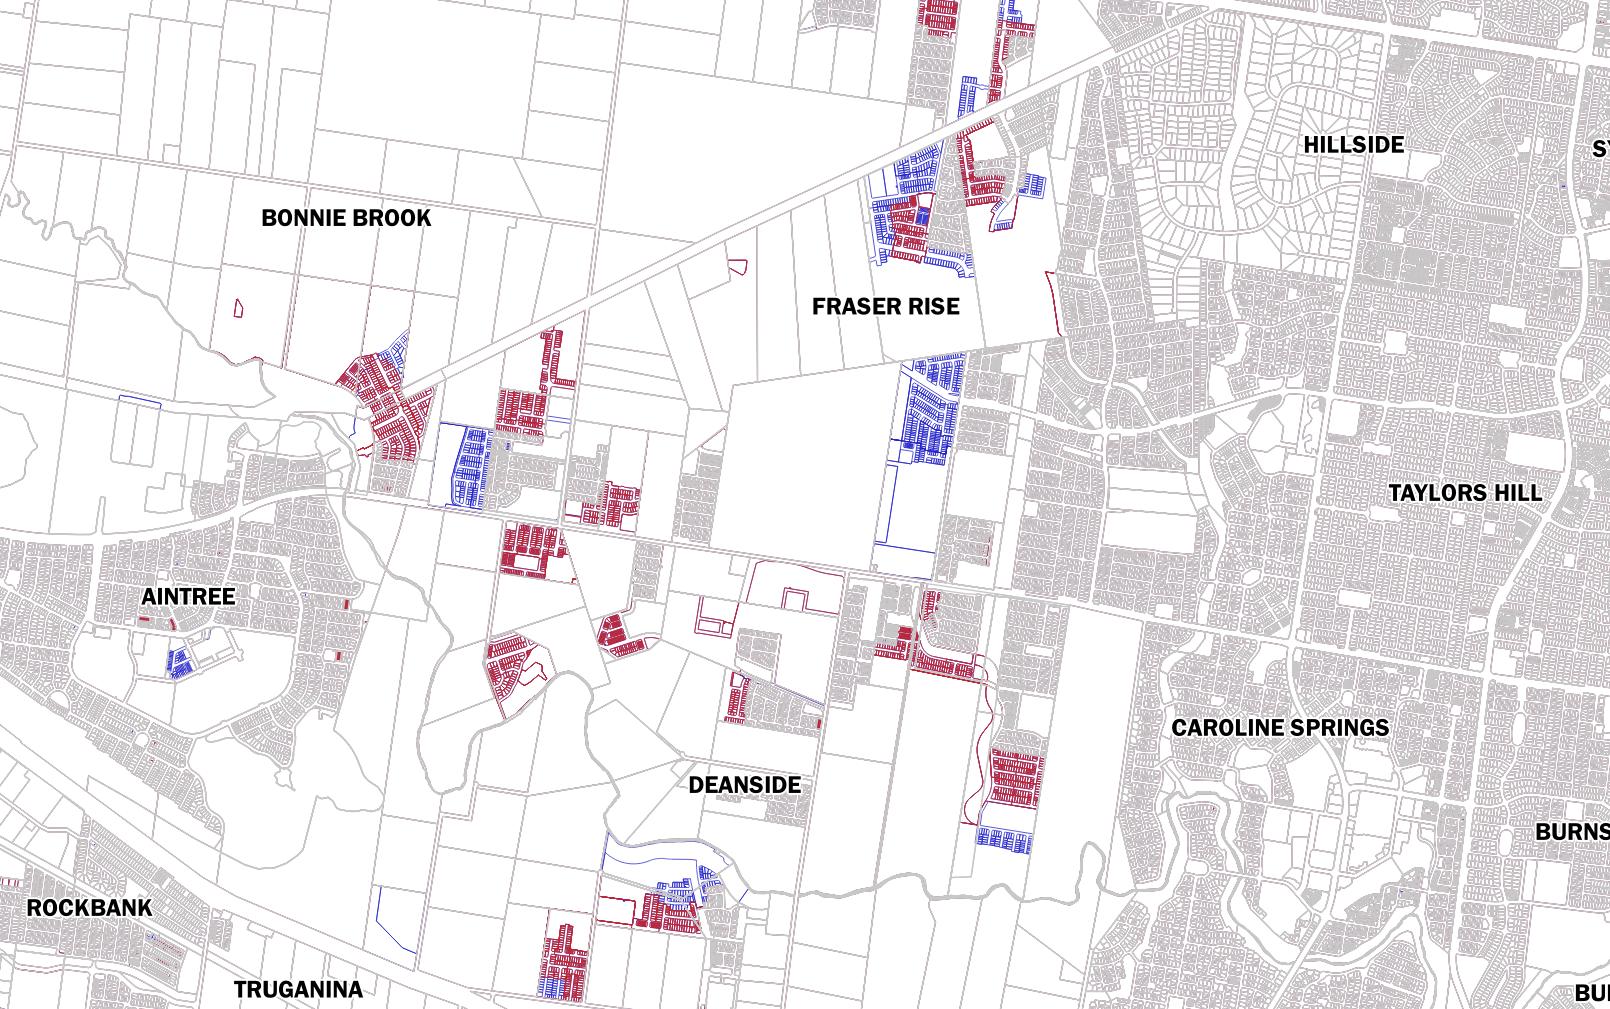
These subdivisions are a lead indicator of future development – usually followed by lot sales and building approvals.
So what’s the issue?
One of the key demographic drivers of growth in these areas in recent years has been overseas migrants.
We’ve seen the short-term impacts
In the short term, the demand for dwellings driven by overseas migration shows up in the inner cities. We’ve already seen a significant increase in the vacancy rate in inner-city areas.
But what about the mid-term?
There will also be significant impacts after a demographic delay .
In recent years, our growth fronts (new greenfield estates on the fringes of our fastest-growing outer-suburban areas) have become home to new arrivals, with the proportion of the local population who are born overseas frequently exceeding 50% of the total population of these areas.
This established and predictable demographic pattern has given developers the confidence to continue investing in these new estates. Yet now, even as this lead indicator of overseas migration has changed so significantly, development in these areas continues to surge ahead.
Our view of what’s coming
When you remove 300,000 people from the population- who were expected to come to Australia in 2021-21 – suddenly, there are more are dwellings set to be built than there are people (households) to occupy them.
Our forecasts show these impacts will be felt in our cities, growth areas, and in our established suburbs.
In a period of such seismic demographic shift, it could play out in a number of ways.
- Overseas migration could turn right around (but the lead indicators we have don’t suggest this is likely).
- The planned developments could come online, but we see a significant vacancy rate for some years. In this eventuality, an oversupply of housing could reduce prices, allowing more people to buy a home, bringing forward new household formation.
- Or, those planned developments simply aren’t built, which has significant implications for anyone planning to service future demand.
If Thursday’s data was a vindication of what seemed to be a radical view of population change in 2020-21, then it’s an important time to monitor how this evolves.
Pre-register for the eBook
If you would like to understand this issue in more detail (particularly how it relates to sectors such as utilities and retail in planning for future demand in these areas), you can pre-register for a copy of ‘ Demographic delays: how closed borders will impact future demand for services ” here.
About our Small Area Forecast information (SAFi)
Our SAFi forecasting model helps our clients make informed decisions by helping them understand the timing, location, and magnitude of future changes in population and dwellings for custom forecast areas that are relevant to their organisation. This approach to forecasting is unique in Australia, in that it produces detailed, highly-localised forecasts that combine rigorous demographic modelling with the ability to rapidly respond to significant changes in the assumptions that underpin any forecast (such as net overseas migration) as new information comes to hand.
Learn more here about the work we’re doing with Australian utilities and other service providers to help them plan for these impacts.
A note about different types of forecasts
This analysis has been prepared by our SAFi forecasting team. Read more about the difference between our publicly-available forecasts for local government areas and those produced for custom catchments here.
Also published on Medium.