The first quarterly decline in Australia’s population on record
The word unprecedented has been given a good workout over the last year, and yesterday, a quite remarkable reporting update from the ABS gave us good reason to use it again.
In the September quarter of 2020, Australia’s population declined by 4,200 people (-0.02%).
Net Overseas Migration (NOM), which has, in recent years, been the primary driver of population growth in Australia, dropped to -34,804 people, having averaged between +50,000 to +75,000 per quarter over the last five years, and even higher in the late noughties.
Though truly remarkable, these figures aren’t actually unprecedented – we have seen population decline in Australia before. It was over 100 years ago during World War 1 – 1916 – when Australia’s population was just under 5 million people (a fifth of what it is today) and soldiers leaving Australia for the battlefields of Europe were being counted among our departing migrants (and of course, many of them never returned).
As a quarterly figure, yesterday’s data is indeed unprecedented. This is the first time we’ve seen a population decline in a quarter since the ABS started keeping quarterly population figures in 1981.
What’s caused the dropoff?
Simply put, a lot more people left the country than arrived. But who were these people?
We don’t have detailed demographic data about who makes up the Net Overseas Migration count. However, we know that most of Australia’s NOM comes from overseas students, backpackers, temporary work (old 457) visa holders and New Zealanders. So that’s likely to be representative of who went home – and have yet to return – leaving us with the current NOM deficit.
What are the state-level impacts?

The inter-state migration story is interesting. While it would appear on the surface that some states ‘gained’ population compared to their interstate migration figures from September 2019, it was, in fact, often a product of people not moving interstate.

Victorians fleeing lockdown?

Popular press says Victorians are leaving in droves to live in Queensland and elsewhere. The reality, when you look at the data, is people aren’t moving.
The number of interstate departures from Victoria in the September quarter was roughly the same as in September 2019, but as a state that has historically gained migration from Queensland and New South Wales, net losses intrastate are caused by the fact the people in those other states are now staying put.
What is interesting is that interstate migration is negative but not as much as overseas migration. It’s incredible that so many people left the country due to the lockdowns – almost as if they were choosing places with much worse COVID than in Victoria, in preference to lockdown.
In historical terms, Victoria losing 16,000 people in a quarter is significant. In 1916 the state lost 20,000 in a year – so if Victoria has another quarter like that it will probably be the biggest population decline in the state ever.
Also interesting will be the metro-regional splits, which we’ll learn more about when regional data comes out on March 30.
NSW
New South Wales typically loses migration to Queensland and some to Victoria. And while total arrivals from interstate were down, they lost fewer people interstate than they did a year earlier, for the same reason discussed above – fewer departures (more people stayed put!).
QLD
While growth is down a bit, Queensland benefited from the same trend – total arrivals were down a little, but far outweighed by the reduction in total departures. So while Queensland still had a net gain, the big benefit came from people not leaving.
WA
The interesting thing about WA is that while the Net Interstate Migration was modest in the September 2020 quarter, it was positive. For many years since the mining boom, Western Australia has lost population interstate (around 12,000 people only a few years ago). This represents the fact that big fluctuations in the WA population are driven more by mining than any other factor.
SA
South Australia also had a small win. As a state that has very little natural increase (population growth from births-deaths) due to their relatively older population, South Australia typically loses population interstate- have done for the last 30 years. However, in the September Quarter, they eked out a net gain of 77 people (a swing of 1069 from the previous September).
Just a bad quarter? What’s the outlook for the December quarter?
It’s fresh enough in our memories that we can remember how bad things were in September (we’re coming to you from Victoria today).
So is this just a bad quarter? The worst of it? Can we expect things to turn around when we get the figures for the December quarter?
In recent years, September has been one of the strongest quarters of the year for overseas migration, making the -35k NOM figure even more significant.

Source: https://www.abs.gov.au/statistics/people/population/national-state-and-territory-population/latest-release#states-and-territories
Looking forward to the December quarter, one lead indicator is the arrivals and departures data we get from the passenger cards people complete when they enter or leave the country.
It’s important to note these are an entirely different dataset to NOM (people counted in NOM are only a slight portion of the total arrivals and departures), however as we have data to January 2021, it would show if there was a likely return to ‘normality’ in December.
Unfortunately, that doesn’t appear to be the case. There has been a modest increase in the net of arrivals and departures after a low point in August 2020..
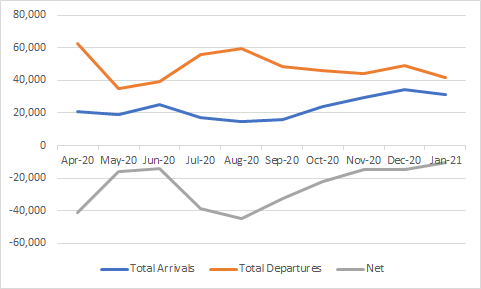
but it’s no where near a return to the pre-covid levels..

Implications for future development
In a follow-up blog next week, I’ll be looking at some of the questions these NOM figures have raised with our forecasters, who are trying to reconcile the pipeline of dwelling development with a significant decrease in population outlined above.
In the coming weeks, we will be publishing an eBook looking at that subject, and the implications for utilities and other service providers who need to plan services for our communities. You can pre-register for a copy of that eBook here.
More detailed info coming at the end of the month
On March 30th, the ABS release Regional Population Growth figures. This will give us all the data on how this is affecting Local Government Areas, which will be of interest to our friends in councils across Australia.
These data are only up to June 2020, not September, but should be a good indication, and it comes with migration numbers, which are expected to show movement from the capitals to the regions – a trend we’re hearing about anecdotally and is reported widely, but the data will tell us the true scale of this demographic shift.
Also published on Medium.


