As many councils work to support their local communities, businesses and industries during the Covid-19 pandemic, Ryan James reminds us of some basic methods to assess the status of your local economy.
Webinar |Since this post was first published, our economics team presented a webinar sharing the early results of the work they’ve done to understand the impact of Covid-19 on local economies. You can watch a recording of that webinar here.
Coming soon: economic forecasts | Our economics team are also developing a new economic forecasting tool, that will provide estimates for a number of economic indicators for every Local Government Area in Australia over the next eight quarters. You can subscribe here to be sent updates about this project, and be notified when the forecasts are available.
We know that many people are doing some baseline analysis to identify how vulnerable their local area is. Understanding the ‘pre-Covid’ status of a place sets the context from which we can assess likely impacts and prepare our localised responses to this significant ‘shock’ to the economy.
This blog outlines some key factors to help you assess the status of your local economy. It includes four recommendations to guide an assessment of how vulnerable an economy may be;
Use up-to-date data from reliable sources
It is important to use current and verifiable data. It sounds obvious but economic data at the local level can be very challenging to find. Macro and State data is somewhat easier but local area data takes specific expertise. And with the increase in opinion pieces and speculation, it is increasingly important to use dependable sources.
The local area economic data in our local area economic profiles were updated in January to show the state of local economies throughout 2018/19. This captures the more than 800,000 jobs and $118b in GRP added to the Australian economy since the last Census, and provides an important recent baseline for ‘pre-Covid’ activity.
This baseline data provides an important understanding of your region’s economic drivers and industry mix, based on the latest data, which will be critical in developing actions through the impact and recovery phase of COVID-19.

Use benchmarking to set your local context
When we conduct training sessions with local councils and communities, we are often asked how to interpret the economic data presented. We suggest a simple but powerful technique called “dominant-emerging” analysis as a really good way to make sense of the data.
‘Dominant-emerging’ analysis is based on asking two questions about any area:
- What role does it play within its region? (benchmarking)
- How is it changing? (change over time analysis)
Benchmarking allows you to identify the role and function of your economy. Where possible, undertake a comparison to other areas (we recommend you choose a regional benchmark (e.g. regional QLD) or a similar LGA, rather than a state or national benchmark), so you can identify challenges that are specific to your area. This information can help you tailor your response. You can find a list of economic data for every LGA in Australia for comparison on our national economic indicators page.
Change over time analysis allows you to see how the current impacts compare to trends over recent years. Understanding whether an industry was growing or declining pre-Covid is a key element to planning for the future, and establishing whether that be a return to business-as-usual or a new vision for your place.
Assess vulnerability indicators
Some areas are more vulnerable than others, and while many indicies and classifications have been devised to measure the relative status of both social and economic exposure in recent weeks, here are a few that we are currently using.
Exposed Industries
Some industries are more impacted by coronavirus than others. NIEIR has developed an economic model of the sectoral impacts of COVID-19 at the national, state and LGA level. Assumptions are made about the effectiveness of health measures and economic policies. The table below provides a summary of the sectors most impacted.
Using this information, combined with an understanding of your dominant and emerging industries will provide you with information about sectors most vulnerable in your LGA.
This Special Report from IBIS provides another perspective about the industry impacts and why some industries are more vulnerable than others.
International Supply Chains
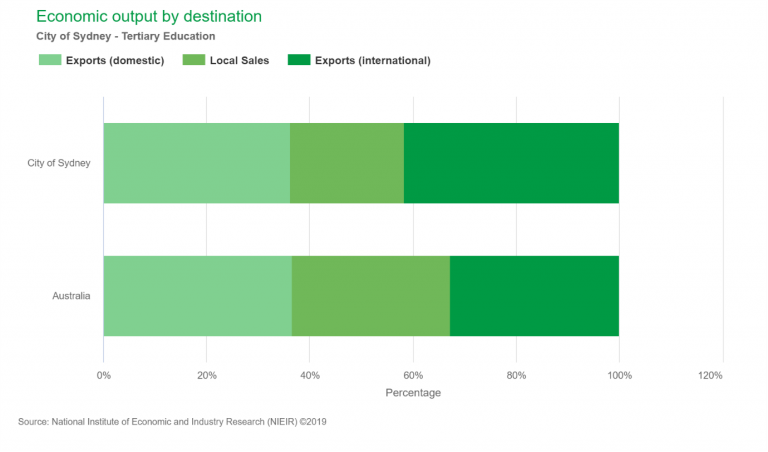
The fall in economic activity in our trading partners, which will be on average around 5% for the 2020 calendar year, will heavily impact Australian exports over the next nine (or more) months. Analysing the export reliance (overall and by industry) of your economy will help you understand how vulnerable your local economy is to a fall in global demand.
Here is an example from the City of Sydney that shows how their Tertiary Education sector is more reliant on international exports than the rest of Australia.

Exposed Workers
Exposed workers can show the connection between economic conditions and the wellbeing of your residents and includes the number of people engaged in casual employment and low-income workers. They often have less secure employment and may be more at risk of being furloughed or having inadequate income during this time.
It is particularly important for those providing community services to know the numbers of people at risk of losing their jobs, or if hours worked are reduced, as demand for support and social assistance may increase.
The example below shows how Onkaparinga in South Australia has a higher proportion of workers with less than full-time hours who may be exposed.

Tourism
The social distancing measures will see tourism activity fall significantly across Australia. Regions reliant on tourism and hospitality are particularly vulnerable to these impacts.
Our economic profiles identify the percentage of a Local Government Area’s employment and economic activity is reliant on Tourism related activity.
See below, nearly 20% of employment on the Gold Coast was Tourism related before COVID-19, well above the Queensland average. The tourism vitiation pages can also tell you about the share of visitors who are domestic or international which can provide further insights into the nature of the impacts and duration of recovery.

Identify new data that will help you monitor progress
We will be releasing regular updates, so you have a repository of information to keep you up-to-date and informed. This will include;
In addition to these tips to help you understand the impact of COVID-19 on your local economy, our community team has recently published a series of indicators to help you assess your community’s demographic vulnerability to the pandemic.
Questions?
We are here to support local government as you work to support your local communities. If you have a question you would like our experts to answer and share on our blog, submit it here. Otherwise, stay subscribed to our blog for more updates and resources throughout each phase of the Covid-19 response period. We also don’t mind an old-fashioned phone call!


