Nearly one-in-five people volunteered in the 12 months prior to the 2016 Census. In this piece, Glenn shares his 2019 update to the Australian volunteering story, highlighting the age groups that are most likely to volunteer, the difference between metropolitan and regional areas, and the local government areas with the highest rates of volunteering in Australia.
Since the 2006 Census, the ABS has collected information on whether a person volunteers for an organisation or group.
This is quite useful to our local government clients, who often are responsible for organising and maintaining an army of volunteers, who assist in the local community with sporting clubs, aged care, maintaining parks and gardens, keeping schools going and looking after the disadvantaged.
See volunteering data for your community – open our directory of community profiles here.
The 2016 Census showed that 3.6 million people had volunteered in the community in the previous year, or 19.0% of the population, up from 17.8% in 2011, an extra 530,000 volunteers over 5 years.
The question is quite broad – to answer “Yes” you only have to have volunteered once in the past 12 months. But the power of Census is not the detail of a specific question but the ability to cross-classify against other characteristics and paint a picture of a specific community.
So who are these people who are volunteering?
Here are a few key facts about Australia’s volunteer;
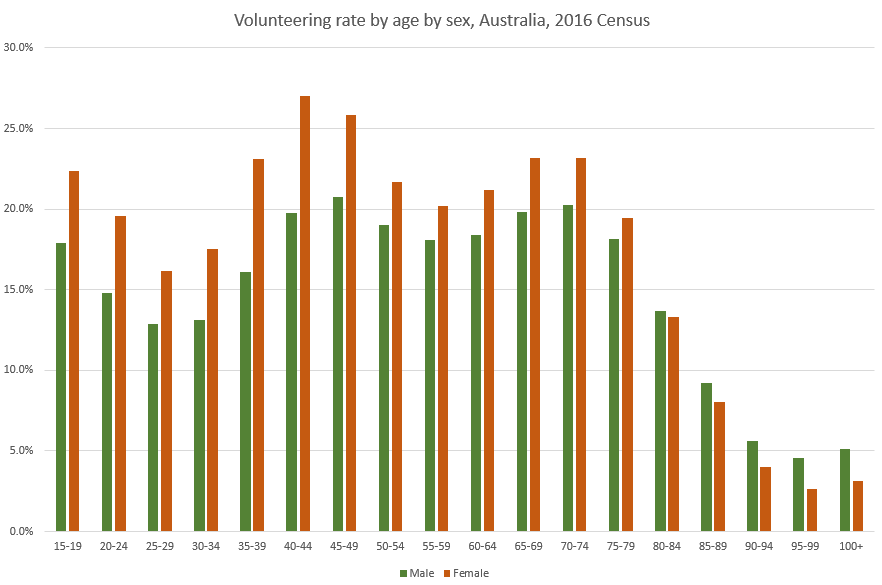
- Females are more likely to volunteer than males (21% of females to 17% of males).
- The age at which people volunteer has three distinct peaks. Females in their 40s (but much less so for males), and both sexes in their late teens and again in senior years from 60-75 for both sexes (but again more for females).
The peak among people in their 40s is interesting and likely corresponds with volunteering around school and children’s activities, hence the higher peak for females. For older populations, at retirement age, the peak is more close between the sexes, and this makes sense as many people volunteer after leaving the workforce.

- Among the very elderly population the gender balance reverses, and more men over the age of 80 volunteer than women, as a percentage of the population (it’s worth remembering that male life expectancy is lower, so while there are far fewer men in these age groups, a higher percentage of men volunteer, but there are still more female volunteers over 80, even though the rate of female volunteers over 80 is generally quite low).
- At a state/territory level, the highest percentage of volunteering is in the ACT, at 23.3%, followed by SA (21.4%) and Tasmania (21.3%). NT is the lowest at 17.1%
- People in rural areas are far more likely to volunteer than people in urban areas. Overall, Regional Australia (outside the major capitals) had a volunteering rate of 21.4%, compared to 17.7% for the capital cities. But some rural areas have extremely high rates of volunteering. The highest rates are in these LGAs, which are almost entirely in SA and WA.
- Non-English speaking background populations are generally less likely to volunteer than Australian-born (or at least they are less likely to state volunteering on the Census form). It’s possible that some Culturally and Linguistically Diverse populations may be actively volunteering in the community but not identify with this in an official sense, or there may be a lack of understanding of what the question means.
Volunteering data is available in all our community profiles, with a breakdown to suburb/district level. You can find the volunteering data under the ‘What do we do?’ menu on the left, with data going back three Census periods.


