Whangarei District- riding the Auckland wave?
Whangarei District Council recently joined the .id stable with the launch of their Community Profile and Social Atlas tools. Penny looks at what’s behind the rapid population growth in this idyllic corner of New Zealand.
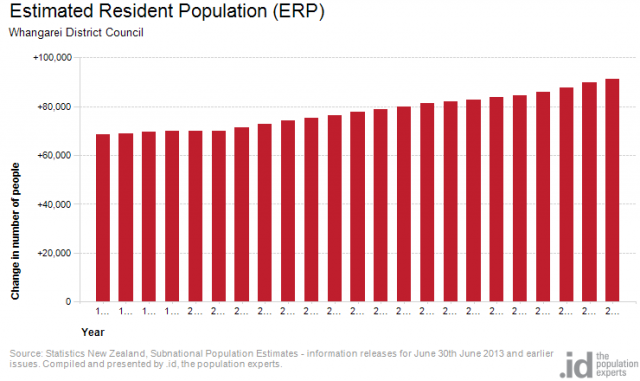
The Whangarei District Council’s estimated resident population (ERP) in 2018 was 91,400, with a population density of 0.34 persons per hectare. The 2017 ERP found the District to be one of the fastest growing in New Zealand alongside Waikato and just behind Auckland.
The following chart shows population change over the last 20 years.

At the time of the 2013 Census, Whangarei was ranked as the 9th largest council in New Zealand with a population that constituted 1.8% of New Zealand’s total population. At first glance the District’s demographic indicators appear very middle of the road:
- it has a median age of 42
- the proportion of its population under 5 is 7.2%, similar to Auckland, Queenstown, and Taupo (ranking 25)
- over 65s make up 18.1% of the population (ranking 20)
- 27% of the population list Maori descendants (ranking 14)
- those with qualifications equate to 12% (ranking 25)
- 15% of residents were born overseas (ranking 20) – a figure similar to councils like Marlborough and Mackenzie District.
(You can see a full list of indicators to see how Whangarei compares to other parts of New Zealand on our New Zealand Demographic Indicators page)
The rapid growth of Whangarei
Despite this unremarkable demographic profile, Whangarei has a history of rapid change. The population of the district was a mere 14,000 as WW2 came to a close in 1945.
Just two decades later, Whangarei was declared a city as it reached a population of 30,000.
The turn of the century saw a period where the population remained relatively static before it started on a sustained trend of growth – increasing from 70,000 in 2000 to current levels of over 90,000.
Migration has played a large part in this growth. In the year ending 2018, a population increase of 1.6% increase in population could be attributed to net migration, while natural growth accounted for 0.4% growth.
Historically neighbouring Auckland and Far North Councils have dominated migration numbers – both inwards and outwards, it is reasonable to expect the 2018 census figures to show continue movement between those areas, particularly Auckland.
Source: Statistics New Zealand, Census of Population and Dwellings 2013. Compiled and presented in profile.id by .id , the population experts.
Learn more about Whangarei
For more information on the socio-demographic profile of Whangarei District, check out the new Whangarei District community profile, which is publicly available thanks to a subscription by the council.
Penny - Population expert
Based in New Zealand, Penny primarily looks after our Kiwi clients but also lends her expertise to the Australian context. Penny has extensive experience as a Communication Manager in Local Government and has a degree in Business and Communications. She also brings a breadth of generalist management experience in fields as varied as research, civil defence, project and event management, marketing and training. Penny’s knowledge combined with the .id tools help clients work with their communities to empower grass roots decision-making, advocacy and grant applications, and focus on strengthening council-community relationships. Penny has a rural property and enjoys growing and eating food and wine, which she runs, walks, bikes or swims off, when she’s not in the art studio.


