BLOG
It’s 2019! Is Census data outdated?
It’s 2019! Is Census data outdated?
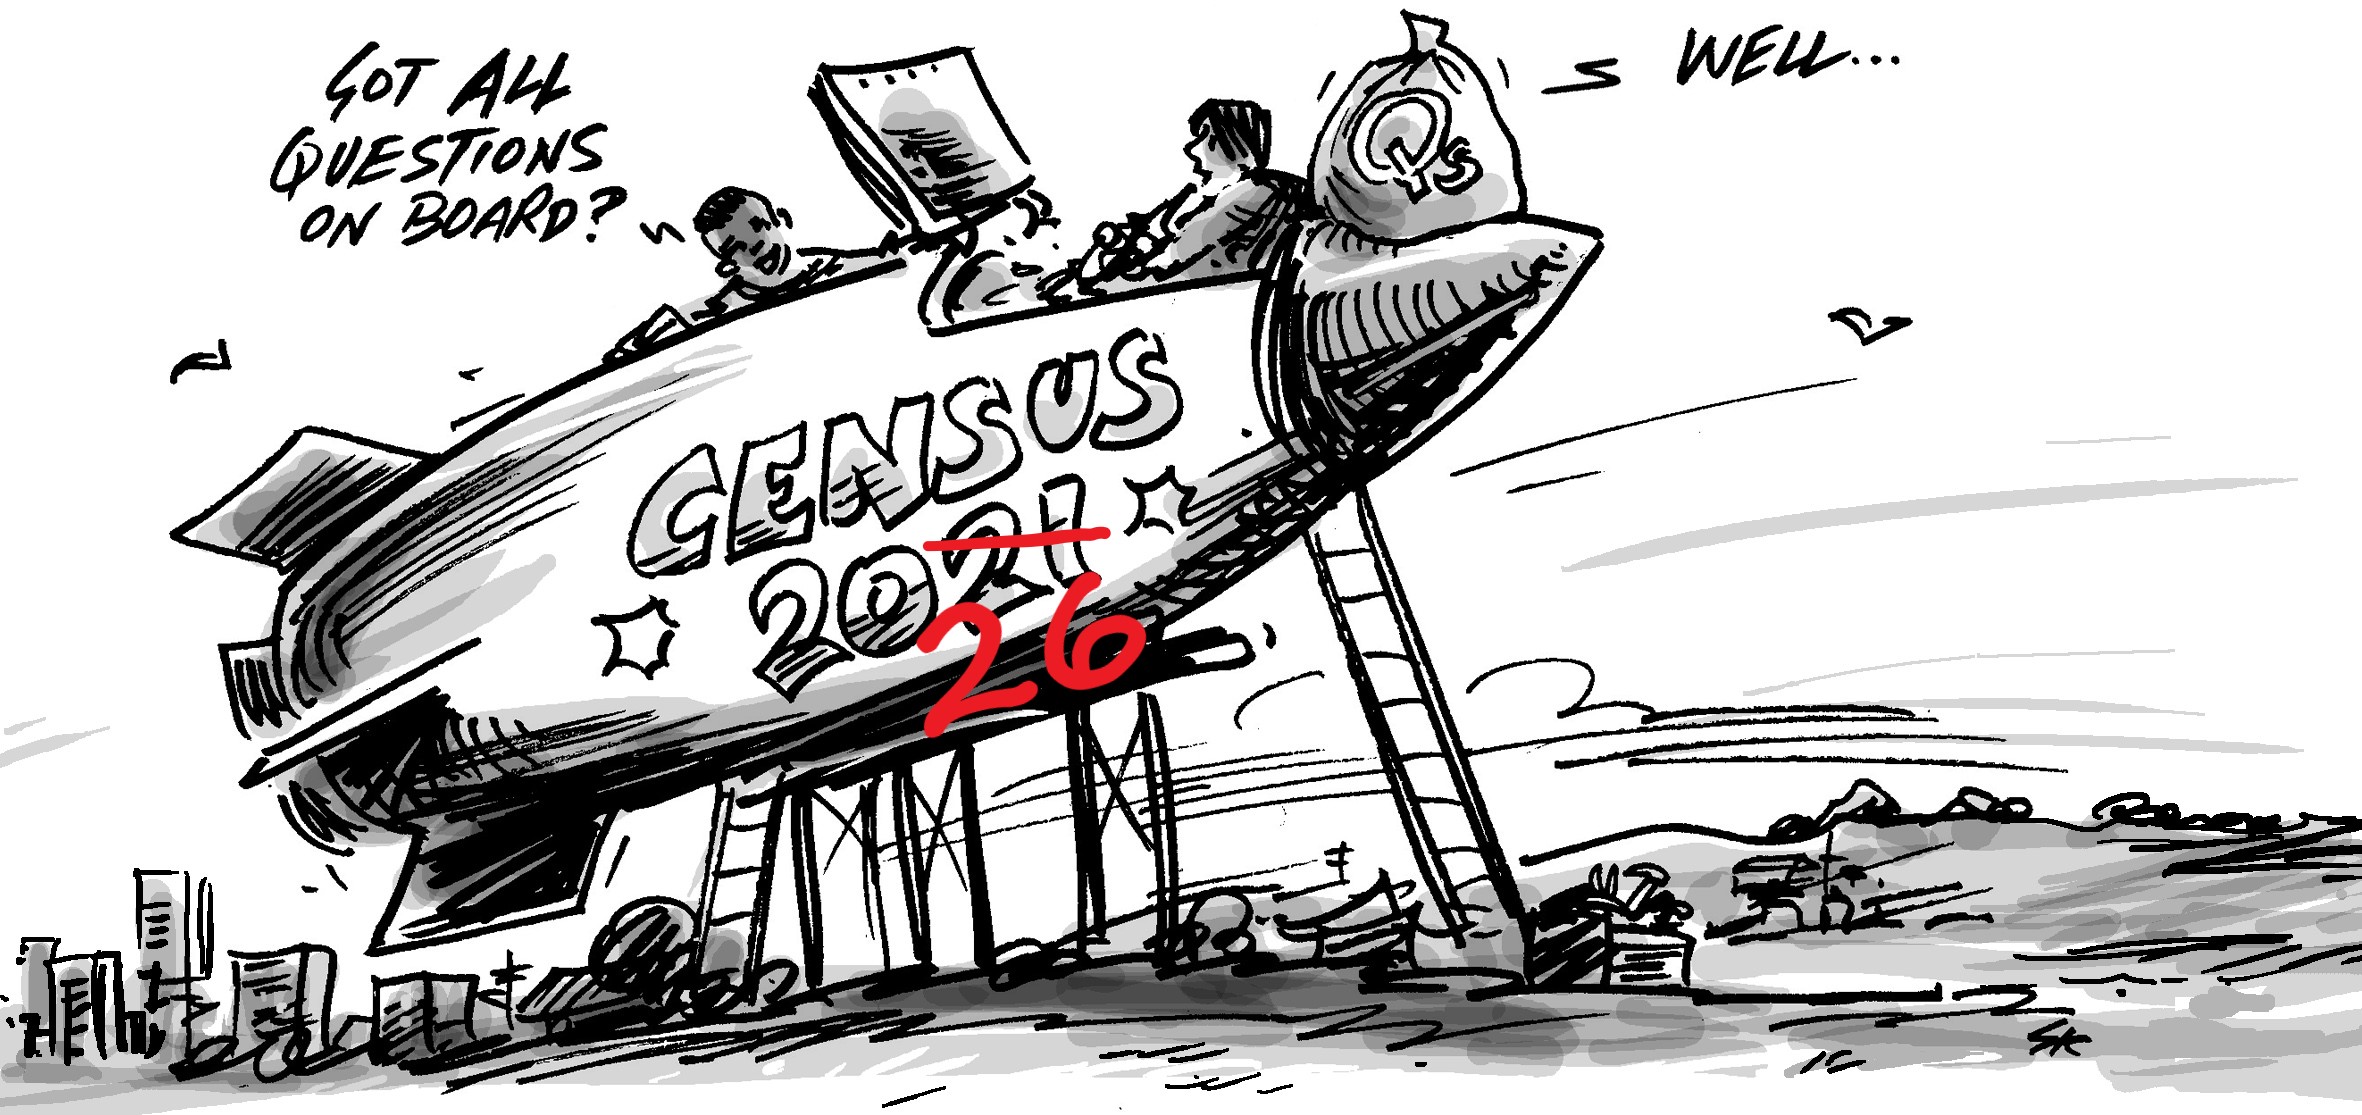
About this time each Census cycle we sometimes get the question ‘Isn’t the data from the last Census a bit outdated?’. In this piece, we discuss why – in Census terms – 2016 isn’t long ago (and why that’s beside the point).
Welcome to 2019
If you’re a regular user of Census data, this article probably won’t be news to you. But if you’ve just uncovered your first great demographic story citing data from 2016 (and hopefully earlier Censuses too), you may be wondering if you’re safe in your assertions.
The short answer is ‘yes’. But let’s look at why.
For our readers in New Zealand, Statistics New Zealand will announce in April when data from the 2018 Census will be released.
The gold-standard demographic dataset
The Australian and New Zealand Censuses are the only complete demographic datasets collected by our countries.
When it comes to data about the demographic makeup of our population, the Census is an unrivalled source of insights. Uniformly profiling the entire country, the Census data is output at Meshblock geography , which lets us tell more nuanced stories about the communities that make up our country than we could with other data published at postcode, LGA or SA2 geography.
Other countries, such as the US and UK, have decennial Censuses (every 10 years), so we’re lucky to have access to more up-to-date insights that let us closely track trends in population in Australia and New Zealand.
It’s about how you use Census data
If you’re looking at demographic data for a single point in time (e.g. 2016), you’re not getting the most out of the Census.
The real power of Census data is the ability to benchmark to another place and tell a story of change over time.
We write a lot about these two techniques for understanding the story of a place. Benchmarking tells the underlying character of a place; change over time helps you understand where that place is in a cycle of change (and that helps you understand the likely future).
Big demographic trends happen slowly
Typically, the underlying demographic character of most places doesn’t change that fast.
It takes some time for an area to change its fundamental character – so that’s why benchmarking and change over time are so important. Trend analysis, rather than point-in-time analysis, is crucial if you are looking to make long-term investment decisions (whether that’s in community services, infrastructure, new premises or policy) – you don’t want to be caught out by a blip in data.
By looking at trends, you can tell a story of how the demographics of an area is changing. It is by understanding the past and analysing the direction of change (ie. growing, slowing, emerging demographics) that you can get a glimpse into the future.
This is why we invest so much time collecting and maintaining historic Census data in our community profiles, ensuring the changing boundaries of geographic areas don’t compromise your change over time analysis.
The Census superpower
The Census is also one of the few publicly-available datasets that can be cross-tabulated. We’ve written previously about this Census superpower. Essentially, cross-tabulation allows you to answer practical, pointy questions that give deep insights to a community.
By understanding the demographic characteristics of a subset of the population (for example, ‘Of the people who were born overseas, how many speak a language other than English at home?’), you can better target services, support funding applications and advocate for those who are disadvantaged.
More frequently updated data
While the Census only happens every five years, there are several datasets in our suite of online resources, particularly economic data and some population data such as the Estimated Resident Population (ERP), that are updated more frequently.
| Data | Source | Updated | Latest data |
|---|---|---|---|
| Estimated Resident Population (ERP) | Australian Bureau of Statistics (ABS) | Annually | 2017 |
| Retail trade | Australian Bureau of Statistics (ABS) | Annually | 2018 |
| Consumer price index | Australian Bureau of Statistics (ABS) | Quarterly | 2018 |
| Business location | Australian Business Register (ABR) | Annually | 2018 |
| Businesses by Industry | Australian Bureau of Statistics (ABS), Australian Tax Office (ATO) | Bi-annually | 2017 |
| Tourism data | Tourism Research Australia (TRA) | Annually | 2016/17 |
All the local area economic data we get from our partners at NIEIR (such as jobs, output, exports, imports, value-added, building approvals, unemployment and productivity) are updated annually.
Furthermore, the population forecasts we produce at .id are presented for single-year intervals, so you can pick any single year in the forecast period to understand the future population totals and composition.
2016 data was brand-new in 2017!
As a final point, it’s worth remembering that our statistics bureaus need a year-to-18-months before Census data is ready for release to the public.
In the case of the Australian Census, while the last data collection was in August 2016, it was June 2017 before the first complete datasets were released, with other data such as the SEIFA index released even later (March 2018). Statistics New Zealand will be announcing in April when the 2018 Census data will be released.


