National migration series | Part 4: National versus regional/local migration profiles

From the earlier blogs in our New Zealand migration series we have established that:
- Migration has a history of volatility in New Zealand.
- Permanent Long-term (PLT) inwards migration is at an all-time high – however, more than half the PLT migration total is made up of working and student visas, and these visas do not necessarily contribute to permanent population growth.
- The economy is a major force behind the volatility in migration (inwards and outwards).
- Australia is a dominant player in New Zealand’s migration profile, particularly with young kiwis departing when the economy is bright, and returning when the New Zealand outlook improves – “voting with their feet” (Poot, 2014, p. 1).
So far our discussion has centred on influence at a national and international level. However, for planners in metropolitan, regional and rural centres a better picture of the local scene is needed.
Where do migrants settle?
Table 1 uses immigration data to assess where new arrivals initially intend to live. It is a picture dominated by Auckland. The overall split between the North and South Island is roughly 80/20% to the North.
Table 1. Permanent and Long-term arrivals in 2016.
Auckland, with its huge population, should dominate immigration results but many smaller places have also been experiencing significant change. When overall numbers are converted to a ratio comparing arrivals to the resident population the results show Queenstown welcoming a much larger share of new arrivals proportionally (see table 2).
Table 2. Permanent and long-term arrivals – per 1,000 residents
How have migration patterns changed over time?
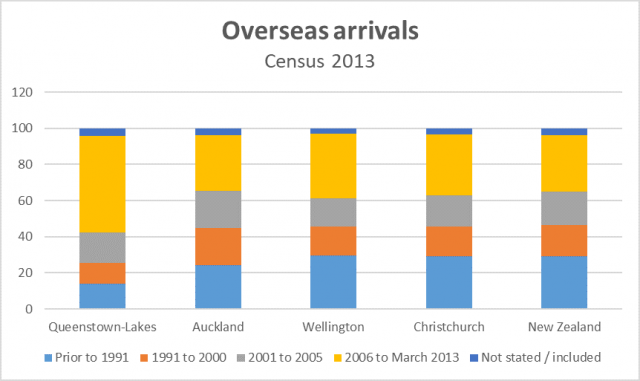
Looking at recent changes is only part of the picture though. For more perspective the census allows examination of the cumulative rate of change. The census question identifies the overseas born population by asking “When did you first arrive to live in New Zealand?” This question is responded to by all permanent long-term migrants, but does not include returning New Zealanders. The resulting dataset is then categorised based on the length of time the migrant has been in New Zealand.
The chart below takes the top four areas identified in the migrant ratio table (table 2) and compares the rate of change across all time periods (i.e. prior to 1991, between 1991 and 2000, 2001 to 2005, 2006 to 2013). It shows that Queenstown’s recent high level of migrants is the crest of a wave of change. Over half of all Queenstown resident migrants arrived in the most recent period, 2006 – 2013.
In summary, the North Island and more particularly Auckland are the main destinations for permanent long-term arrivals to New Zealand. However, if you consider the proportions of incoming migrants in relation to the overall population of an area you can get a clearer idea of the impact immigrant can have on smaller places like Queenstown, Rotorua and even Mackenzie District Council. It is also worth considering the long-term pattern of change.
References
Poot, J. (2014, July). The migration roller coaster and house prices. Asia New Zealand Foundation Bulletin. Retrieved from http://www.asianz.org.nz/bulletin/migration-roller-coaster-and-house-prices.
.id is a team of population experts, who use a unique combination of online tools and consulting to help organisations decide where and when to locate their facilities and services, to meet the needs of changing populations. We provide free resources to help you make the most of demographic data. Access .id’s demographic resources here.
Penny - Population expert
Based in New Zealand, Penny primarily looks after our Kiwi clients but also lends her expertise to the Australian context. Penny has extensive experience as a Communication Manager in Local Government and has a degree in Business and Communications. She also brings a breadth of generalist management experience in fields as varied as research, civil defence, project and event management, marketing and training. Penny’s knowledge combined with the .id tools help clients work with their communities to empower grass roots decision-making, advocacy and grant applications, and focus on strengthening council-community relationships. Penny has a rural property and enjoys growing and eating food and wine, which she runs, walks, bikes or swims off, when she’s not in the art studio.


