Is it time to review growth area planning?
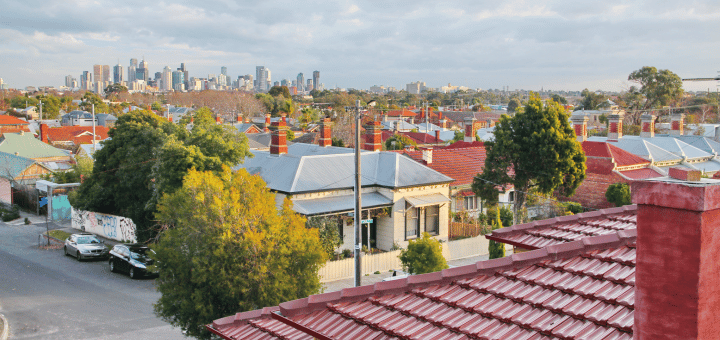
Recently, our Housing and Economics team uncovered some surprising trends in household sizes in some growth areas – trends that have important implications for planning, infrastructure and service delivery in those communities. This piece will be of particular interest to planners at growth area councils, but if you’re in a middle-ring council seeing more dwelling densification, there’s something here for you too.
Our recent study for the National Growth Areas Alliance into Greenfield futures showed that while past greenfield estates had a growing share of older and smaller households, household sizes in these areas actually increased between 2006 and 2016, contrary to expectations.
Our analysis concluded that this change in trends means that we need to monitor and update plans for greenfield development across Australia, as the level of infrastructure planned may significantly understate demand, putting the liveability of these areas at risk.
Greenfield areas – what the theory suggests
Earlier this year, Richard shared the findings from a study we conducted into the demographic composition of greenfield estates and how a greenfield suburb’s lifecycle impacts the future population of those areas.
Typically, Greenfield areas undergo rapid development and population growth over a relatively short period, with young families dominating the demographic profile.
The theory suggests that over time, average household sizes should fall as residential development opportunities dry up, families age in place, and children grow up and leave.
As Richard noted, there has also been a trend towards smaller lots and a greater share of medium and higher density dwellings in greenfield areas, with the expectation that this too would lead to smaller household types, and a fall in average household size (see the suburban life cycle below).

The suburban lifecycle
A shift in housing consumption patterns
However, urban areas are constantly evolving, primarily due to changing household needs and preferences reflecting population and age structure changes, and growth areas are not immune to these broader changes to patterns of housing consumption. The way we consume dwellings is also changing in response to housing affordability, preferences, cultural diversity and economic drivers.
There has been general pressure across metropolitan areas in Australia for average household sizes to increase in line with a general undersupply of dwellings compared to population since the mid-2000s. See below.
Population growth & building approvals
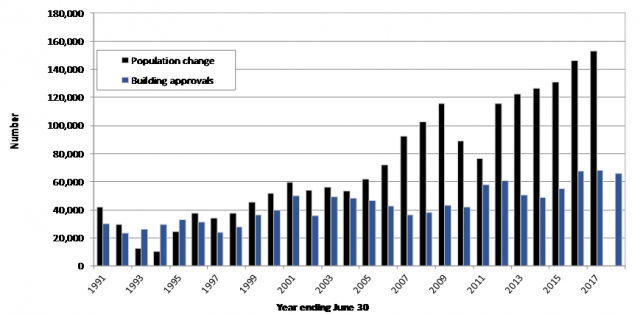
Population growth & building approvals, Victoria, 1991-2018
The rise of multi-family households, once a very small share of total households, is also influencing the demographic profile of growth areas.
One way to look at these changes is through household size trends.
Household size (that is, the average number of people counted in the Census in private dwellings in Australia) has been declining for the last 100 years. In 1911, the average household size for Australia was 4.5. By 2006, it had fallen to 2.53.
There are various reasons for this decline, including;
- Divorce and separation of families
- Lower fertility rate leading to smaller families
- The ageing population (more older lone-person and couple-only households) as well as deferring entry into aged care
- Fewer multi-generational families
- Preference for living alone
But in 2011 and 2016, something remarkable happened – household size increased across Melbourne. This was also the case in Melbourne’s Growth Area Local Government Areas where the average household size increased from 2.96 in 2006 to 2.99 in 2016.
For example, Wyndham increased from 2.9 to over 3.03[1] – a significant increase reversing a long-term trend.
This trend has major implications for the existing and future structure plans for growth areas. The level of physical and social infrastructure currently planned might not be enough to meet the needs of the future population.

Average household size, (persons per dwelling), Melbourne Growth Area LGAs Source: ABS Census of Population and Housing
Selected LGAs seeing significant changes in average household size
Source: ABS Census Population and Housing
 Are you seeing these trends in your area?
If you’re in a growth-area council – whether you’re in strategic planning, infrastructure or asset management or community services team – it’s worth understanding if there’s been a change to the number of people living in dwellings in your area.
If your council subscribes to our community profile, you can see if this trend has appeared in your area under the ‘How do we live?’ menu.
If your council subscribes to our communities of interest module within the community profile tool, you can investigate what demographic characteristics may be contributing to this trend in your area (cultural preferences for multi-generational families living together, student housing agglomeration around universities, young families accessing affordable housing, etc).
If you need help unpacking this data, or would like to take a closer look at the impact of demographic change on housing, infrastructure or services, get in touch with our housing and economics team – they’ll be happy to help.
[1] Its marginal rate was 3.5 people for every additional occupied private dwelling. The share of households with more than 3 people increased by 5.1 percentage points between 2011 and 2016.
Rob Hall
Rob is driven by a desire to help shape communities for a better future. Trained as an economist, he has a unique twenty-year background in economics, demographics, statistics and strategic planning with a focus on understanding how economic forces influences local government areas across Australia. At .id, Rob provides Local Government with high-quality analysis and information tools, including specialised consulting services and tailored information products such as economy.id.