How do Australians get to work?
The 2016 Census contains data on how people got to work on Census day. This is one of only two transport-related topics in the Census (the other one being ‘Number of motor vehicles’), and the data are eagerly sought after.
It has its limitations – it’s a snapshot of a particular day, and it only relates to work travel, not travel to education, shopping or leisure. But it’s the best data we have at a local level that looks at transport patterns.
It’s likely actually that the 2016 Census method of travel to work question is more of a measure of “usual” method rather than a specific day. The reason for this is that the Census website went down on August 9th (in case you’d forgotten), and many people filled in the form days or even weeks afterwards. Remembering the specific method of travel on Census day may have been an issue, so I suspect many would have answered with their normal or regular method.
How we use Method of Travel data
Method of Travel actually consists of 237 different categories. This is because up to 3 methods are recorded, and all combinations of them are recorded separately. The vast majority (about 95%) only used one method, but (for instance) there were 38 people who went to work by bus, ferry and motorbike!
For the purposes of displaying in .id’s community profile, we combine most of these categories together, boiling it down to 13 main categories. The few multiple methods which have significant numbers are combined to form a primary method (for example, Train and Car goes into the Train category). We can then aggregate further into Public Transport, Car, and Other. This is an important step, as it allows you to compare these categories consistently over time, to uncover trends such as those below.
Results for Australia
Under the Method of Travel to Work section of our Australia profile, you can see this data for Australia, states and capital cities.
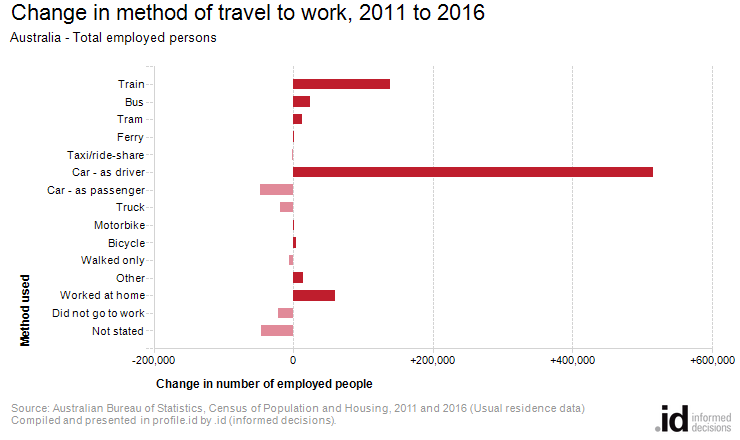
The headline is that Australia-wide, 61.5% of people drove their own car to work on August 9, 2016, showing that motor vehicle use is still dominant.
This was a small increase from the 2011 figure of 60.2%. Car (as a passenger) declined from 5.3% to 4.6% over the same time. So it appears more people are driving themselves and less are being driven.
.png?width=740&height=440&name=travel-to-work%20(1).png)
I do actually wonder if this might be a consequence of so many people not answering the form on Census day. For example, if you usually drive to work but on a particular day you got a lift – you may not remember this a few weeks later. I can’t think of any other explanation for this significant decline in the ‘Car, as passenger’ category – but we will never know for sure.
Public transport use
There has also been a substantial increase in public transport use, particularly trains. Those taking the train to work (including in combination with other methods, eg. driving to the station) rose from 6.3% to 7.2% of all trips to work nationwide, representing an increase of 22% in the actual number of people on the train.
Those in Sydney and Melbourne would not be surprised by this – anyone who’s taken a train in peak hour in either of those cities knows how crowded they’ve got in the past few years!
Greater Sydney and Greater Melbourne combined make up 97% of the increase in train use, with Sydney alone adding 84,000 train users (or 61% of the total Australian increase) to see trains now making up 16.2% of that city’s transport to work. Melbourne added 51,000 train users (to 11.5% of all trips to work), but a similar amount in the previous Census was larger than Sydney’s increase from 2006-2011. So in 10 years, Melbourne has added 100,000 train users, approximately a 70% increase. Tram use has also increased by about 50%.
We combine tram and ferry categories for compatibility with old Census data. But it’s interesting to note that while both trams and ferries are now available in Sydney, only just over 10,000 people (0.4% of the working population) took either a tram or ferry to work as their main method.
In Melbourne, it was about 51,000 or 2.4%. Considering how iconic Melbourne’s trams are, this is also quite low. If you add in those who also took Train and Tram combined (which is grouped under train), this rises to about 70,000 or 3.3%. Melbourne’s tram network really only covers the inner suburbs, which is not where the majority of the population lives. Tram use is still higher than bus use in Melbourne though, while Sydney has almost five times as many bus users as Melbourne.
Public Transport use in other capital cities barely changed, with declines in the number of users of both train and buses in Brisbane. Adelaide recorded a small increase in train use but it still only makes up 2.3% of all trips. While Perth, which has been investing heavily in new train lines and public transport infrastructure, nevertheless recorded a fall in the percentage of train use to get to work, from 6.5% down to 6.1% of all workers. Bus went up a little but it remains a very car-dependent city. The title of most car-dependent city, however, falls to Darwin, with 64.8% of people driving their own cars to work.
Other methods
Nationally, 108,000 people reported riding their bike to work (bike only) – a minor increase of about 4,000 people from 2011. All of this modest increase was due to Greater Melbourne. If you add in people using bicycle along with other methods (eg. riding a bike to the train), this adds about 10,000 people to the total, but even with this, only about 1% of Australian trips to work involve a bike.
A far greater number walked to work – 3.5% of the employed population (or 370,000 people) but this was marginally down on the 2011 figures.
4.7% of all employed people worked from home on Census day, just over half a million people, and an increase of 60,000, or about 12% from 2011. Unlike public transport and bike use, which is capital city focussed, a greater proportion of home workers lived in regional areas, where it made up 5.9% of all workers. This includes farmers working on their home farms.
And finally, 9.4% of Australia’s population did not go to work on Census day. In case you were wondering, this doesn’t include anyone who is unemployed, looking for work, retired, students without a job etc. This is only 9.4% of those who actually had a job (just on a million people) who didn’t go to work on that day.
Part-time work was up this Census, to 36% of all employed persons. But the proportion who didn’t go to work on Census day fell from 9.8% to 9.4%, and 21,000 less people didn’t go to work on Census day 2016 than on Census day 2011. This is counter-intuitive, and I think again we’re seeing the results of people filling in the form weeks later this time – perhaps they didn’t remember that Census day was their day off? A bit different if you’re filling it in on the night.
There are certainly some interesting trends in Method of Travel to work for 2016. The Method of Travel topic is now available for all our subscribers on the community profile sites – you can find it under the ‘What do we do?’ menu item. It’s available for all the suburbs and districts in your area.
If your council or regional organisation also subscribes to our social atlas tool, you can also see – visually – the distribution of people driving to work, taking public transport, riding a bicycle and walking to work on a map, which can tell a very intresting story.
Stay up-to-date
Bookmark our 2016 Census update tracker page, where we announce each new topic release as-it-happens, alongside great insights and analysis from our team of population experts.
Questions?
We want you to feel confident using these updates to understand the story of your changing community.
If you’re still not sure about any of our updates, leave a comment below and we’ll be happy to clarify.
.id is a team of population experts who combine online tools and consulting services to help local governments and organisations decide where and when to locate their facilities and services, to meet the needs of changing populations. Access our local government area information tools here.
Glenn - The Census Expert
Glenn is our resident Census expert. After ten years working at the ABS, Glenn's deep knowledge of the Census has been a crucial input in the development of our community profiles. These tools help everyday people uncover the rich and important stories about our communities that are often hidden deep in the Census data. Glenn is also our most prolific blogger - if you're reading this, you've just finished reading one of his blogs. Take a quick look at the front page of our blog and you'll no doubt find more of Glenn's latest work. As a client manager, Glenn travels the country giving sought-after briefings to councils and communities (these are also great opportunities for Glenn to tend to his rankings in Geolocation games such as Munzee and Geocaching).