The Federal Government’s decision to abolish the Temporary Work Visa (known as the 457 visa), and replace it with the new Temporary Skill Shortage Visa, has stoked recent public discussion about Australia’s migration and settlement policies.
All the talk about migration and skilled occupations got me wondering about the skills profiles of our largest groups of new arrivals. The Census provides us with information about the formal skills of the population, by asking questions about the highest level of qualification achieved and the field in which it has been attained. Once the 2016 Census results are released by the ABS later this month, we will be better placed to draw conclusions about the social and demographic characteristics of people recently migrating to Australia. For now, I’ll consider what 2011 data reveals about the qualifications carried by different migrant groups.
Top 20 countries of birth – Australia’s working-age migrants
I decided to look at the top twenty countries of birth that contributed the greatest number of working-age people (aged 15-64) to the Australian population between 2006 and 2011. As a sample of these 766,238 migrants, I focused only on people arriving in 2010 – this will help ensure that qualifications recorded in the 2011 Census were likely attained prior to arrival in Australia. This analysis only captures those 2010 arrivals who remained here long enough to take part in the Census.
Of the 121,854 working age arrivals from these twenty countries in 2010, around 46% were born in China (24,711), the United Kingdom (16,418) or New Zealand (15,241). Not far behind was India, with 13,901 working age migrants, while the average among the next sixteen birthplaces was a contribution of 3,224 people.

Qualification levels
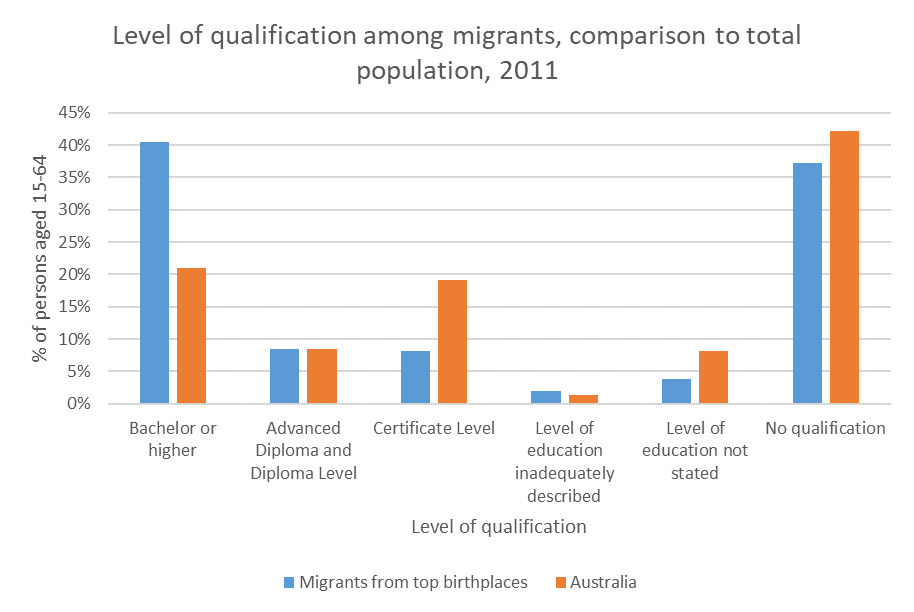
The most common level of qualification among migrants from these twenty birthplaces was a bachelor or higher degree. In 2010, 49,323 people arrived in Australia with at least a bachelor degree, comprising 40.5% of total people aged 15-64 from these birthplaces. As shown in the chart below, this was almost twice as large as the share of the Australian working-age population, just 21%.
Attainment of Certificate Level qualification was far less common among migrants than the Australian average, with 8.2% of arrivals holding a certificate, compared to 19.1% across Australia. Meanwhile, 37.2% of the 121,854 migrants from the top birthplaces held no qualification at the 2011 Census, slightly lower than the Australian average of 42.1%.

Over-achieving migrants
Bachelor or higher degrees are almost twice as common among migrants than across the overall population of Australia. Uptake of these qualifications varies considerably between different migrant groups. The following chart shows the proportion of people with at least a bachelor degree from each birthplace and compares this to the total contribution of working age migrants by birthplace. This helps us understand which groups are the ‘most’ and ‘least’ qualified, relative to the overall number of people migrating from each country.

You will notice that all the countries of the Indian subcontinent, namely Bangladesh, Nepal, Pakistan, Sri Lanka and especially India, ‘over-perform’ in this regard. India accounted for 11.4% of working age arrivals, but nearly 20% of university qualifications. On the other hand, all the birthplaces of north-east and south-east Asia, except the Philippines, had low shares of migrants with bachelor or higher degrees, relative to their respective migrant numbers. The other migratory group with low uptake of these qualifications is New Zealand, reflecting the relative ease with which Kiwis are able to settle across the ditch.
Where do students fit in?
People with no formal qualifications represented large shares of working age arrivals from several countries. The birthplaces with the largest proportions of unqualified migrants were Iraq (63.6%), Vietnam (60.0%) and China (51.3%) while Malaysia (49.9%), Indonesia (49.1%) and South Korea (48.3%) were all close behind.
The prevalence of student migration is a significant factor explaining a large portion of the new arrivals with no qualifications. Census data demonstrates this trend – around a quarter (34,081) of migrants were attending a university or TAFE in 2011. Of this group of students, 15,844 reported that they had no existing qualifications. This is a substantial number, representing 35% of all unqualified arrivals from those countries. Clearly, a large share of those migrating with no qualifications moved on a student visa, with the aim of attaining their first certificate or degree in Australia.
The chart below breaks this down by birthplace. It shows the share of migrants attending a university or TAFE with no existing qualifications, as a proportion of all unqualified migrants arriving in 2010. Comparing this chart to the birthplaces mentioned above, we can see that first-time students account for most of the unqualified migration from Malaysia (77.2%), Indonesia (65.2%) and China (56%), as well as Singapore (74.8%).
In the case of Iraq and Vietnam, by contrast, students comprise far smaller shares of all unqualified migrants, 16.3% and 33.6% respectively. Iraqi and Vietnamese people will generally migrate to Australia for reasons other than study, often as a part of a family group, to work in low-skill occupations, or on a humanitarian basis.

We know that overseas migration has always played a crucial role in determining the social and economic make-up of Australia. At .id, we’ve also been talking a lot about the changing shape of our economy, with increasing emphasis on knowledge and problem-solving skills. Broadly speaking, neither of these macro trends are likely to change anytime soon, whatever policies are imposed. Following the imminent roll-out of 2016 Census data, it will be fascinating to think about how Australia’s new economy can harness the potential of migrant communities in the years to come.
.id is a team of demographers, urban economists, spatial planners and Census data experts who use a unique combination of online tools and consulting to help governments and organisations plan for the future. Access our free demographic resources here.


