Following on from some recent blogs looking at the changing nature of Australia’s age, ethnic background and religious beliefs, I thought I’d take a quick look at how relationships are tracking.
Last year I (finally) got married myself and it brought into light the stark contrast to my parents’ generation. At my age, my dad was already six years married and my mother was ten years younger than my wife when getting married. According to the ABS, the median age at first marriage in 2015 was 30.1 years for males and 28.5 years for females. This compares to 1974 where it was estimated to be 23.3 for males and 20.9 for females.
Marriage status changes
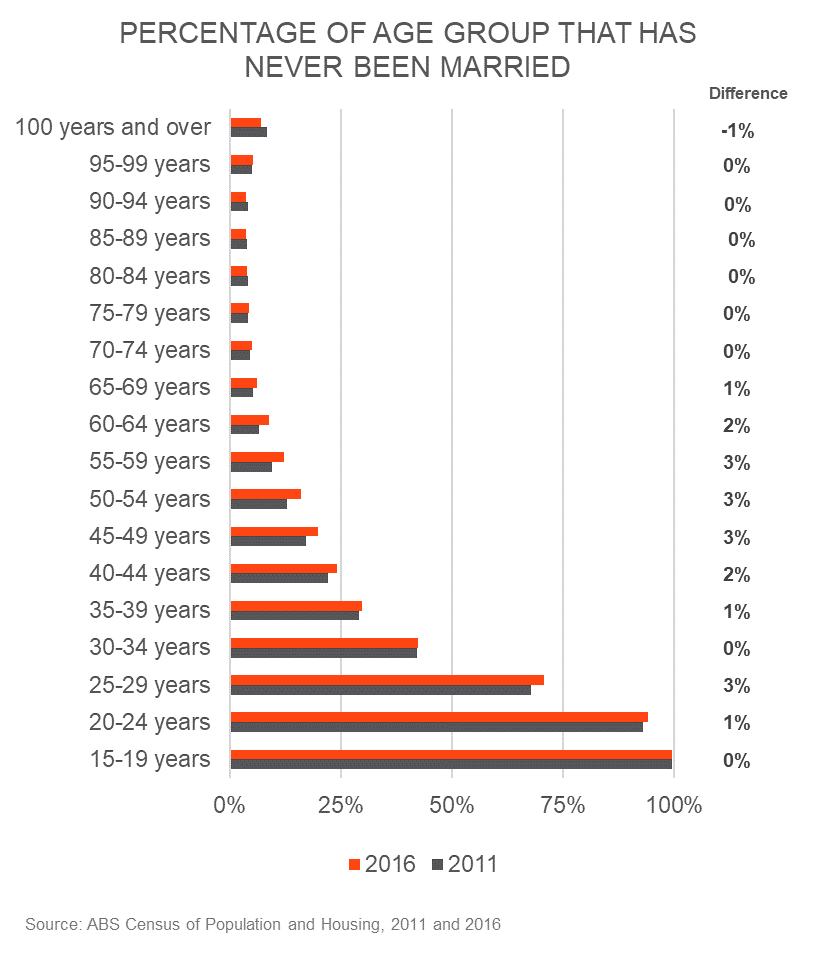
While the 2016 Census doesn’t provide the median marriage age, it does show that marriage is becoming less common. In 2016, 35.0% of all Australians 15 years and over had never been married, compared to 34.3% in 2011. Nearly every age bracket up to 65-69 years of age had a higher proportion of residents in the ‘never been married’ bracket compared to 2011. The anomaly is the 30-34 year age bracket where proportions were basically the same. This could be due to the influx of new migrants in their late 20s/early 30s who are typically more likely to be married than Australian born residents. (In 2011, 42% of 25-29-year-old new migrants were married compared to 30% for all 25-29-year-old Australians). Also, during the intercensal period, the median age at first marriage for men tipped over into the 30-35 year age bracket (it was 29.7 years in 2011).
Divorce rates
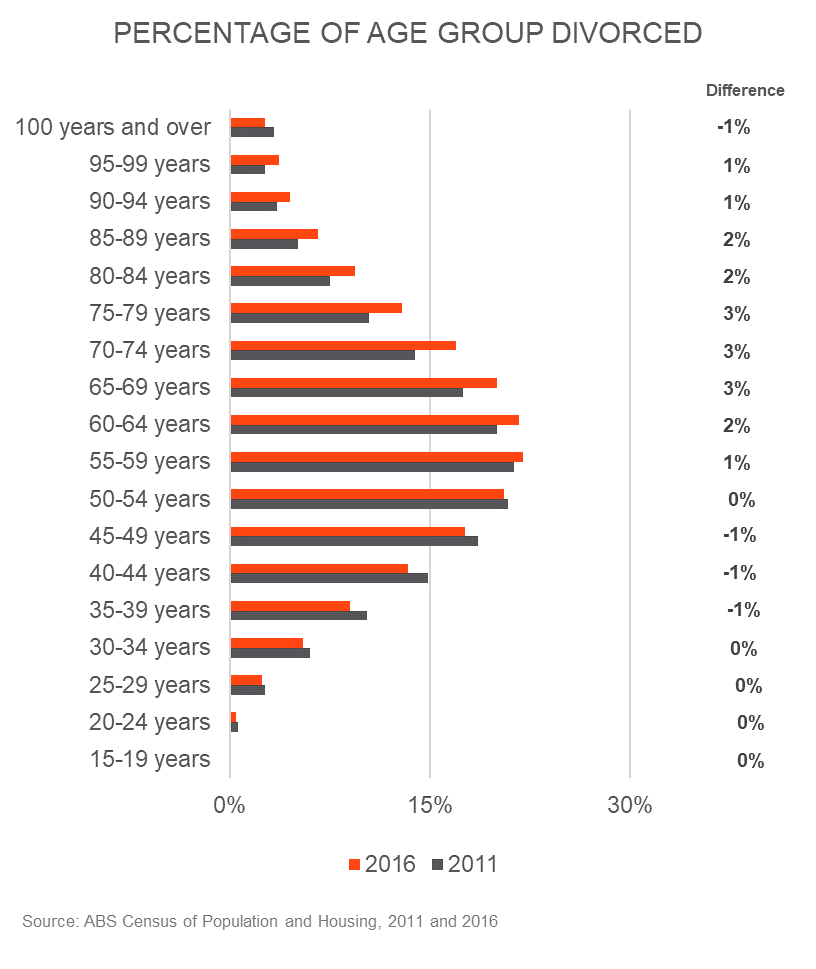
What about divorce rates? It is commonly reported that not only are people marrying later but rates of divorce have also been increasing. Well, the Census shows that there has only been a marginal increase in those divorced or separated, 11.7% versus 11.5%. However, it appears for those nearing retirement or already retired, the likelihood of being divorced has increased. Living longer, growing apart over time? Maybe.
Regarding other changes to household relations, trying before buying is on the increase with couples more likely to be living together in de facto relationships (16.1%) compared to 2011 (15.5%). In addition, same sex couples have also increased, now representing 1% of all couples who live together, up from 0.7% in 2011.
Gender and age patterns
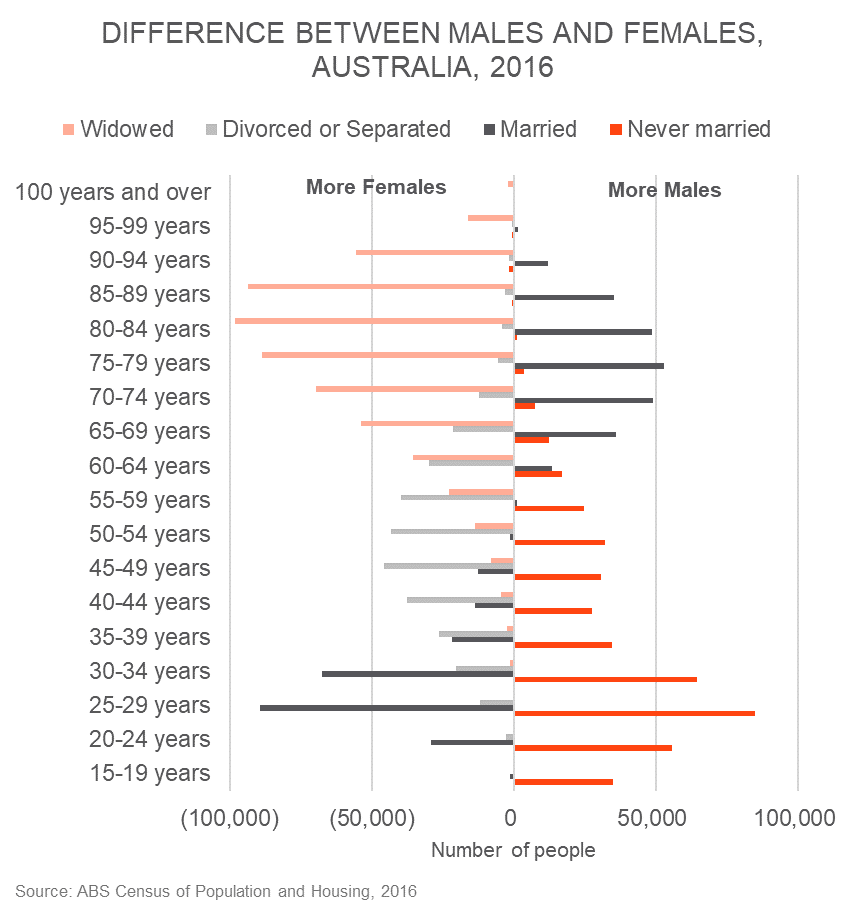
When looking at relationship status based on age and gender, some clear patterns exist. There are far more younger men in Australia who have never been married. This reflects both the higher amount of younger men (almost 58,000 more males than females in the 15-24 years age bracket) and the fact that men generally marry later in life.
By the 30s and 40s age brackets, there are far more women than men in the resident population, but men are still much more likely to have never married. By this age, divorces start to rise especially amongst women. By the late 40s, the excess of divorced women to men peaks and then begins to decline. However, it is replaced by women becoming widows.
Post retirement age, as women tend to live longer than men, the growth in female widows grows considerably. This leads to a large gender gap amongst married people which is reverse to that seen in younger years. Older men are much more likely to be married (72% of 75-79 yr olds) to a partner still alive than women (49%). Married men also live longer than unmarried men so the gender gap within life-long singles disappears. In addition, the divorce gap shrinks, possibly reflecting an older generation where women were less likely to divorce (or their partner died before they considered it).
Spatial patterns
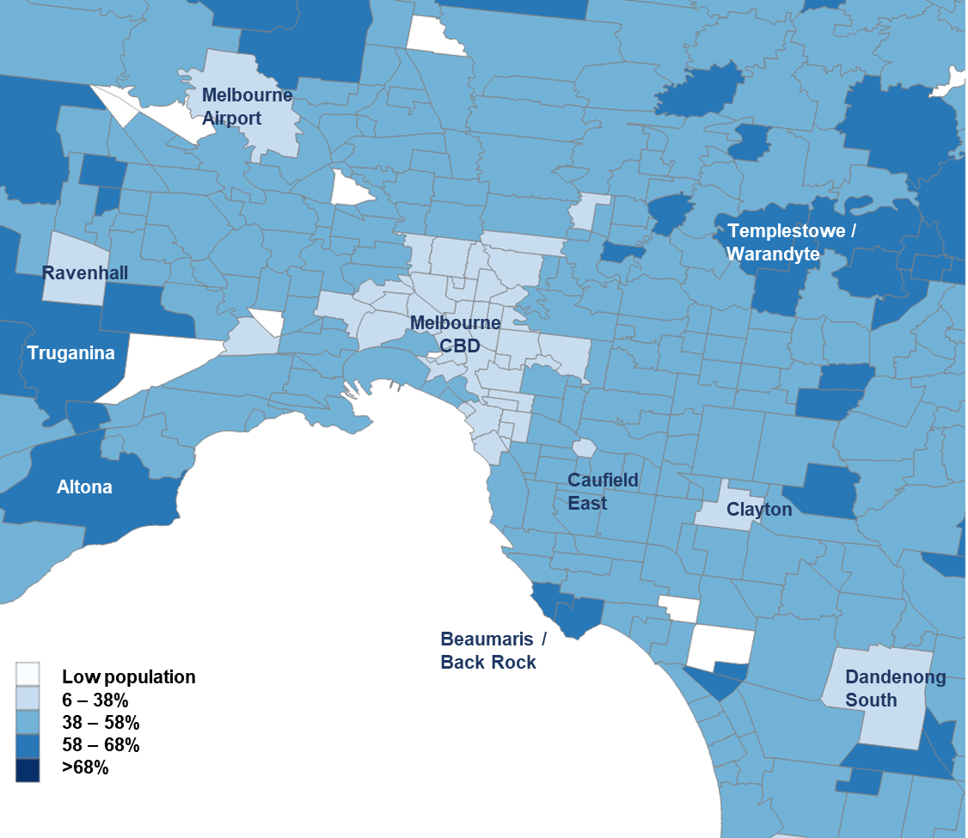
Relationship status often has spatial patterns too, reflecting age demographics and lifestyle choices. If we map the ‘never been married’ population across Melbourne, the inner city and University/TAFE suburbs obviously stand out and illustrate the higher shares of student populations and young professionals living in those areas. Ravenhall is an outlier and reflects the Metropolitan Remand Centre being located there.
Share of Suburb Population that has ‘Never Been Married’
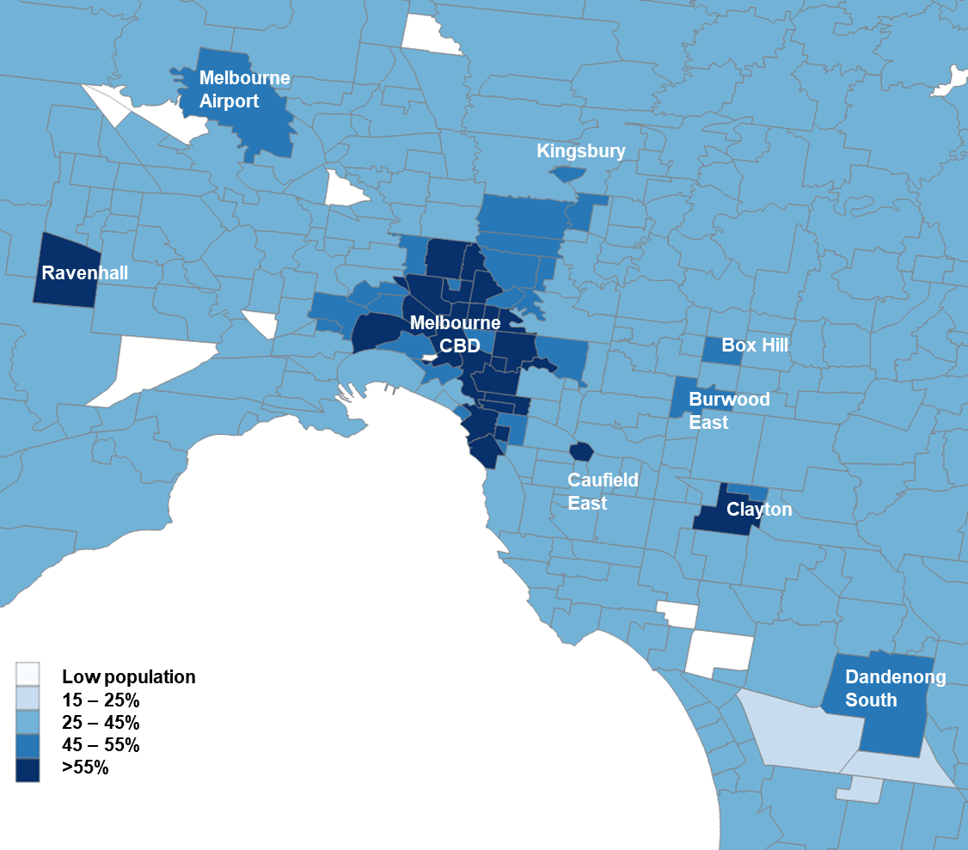
Source: ABS Census of Population and Housing, 2016
Mapping ‘married’ residents, we can clearly see that outlying areas of Melbourne have much greater shares, probably reflecting the affordability of these locations for new families.
Share of Suburb Population that is ‘Married’
What about if you are young and single and looking for a relationship? Well mapping the differences between ‘never been married’ males and females highlights that the inner city is where the abundance of single females is. In contrast, outer suburbs have much higher single male differentials. Also, of note is that there are far more suburbs with higher counts of males who have never been married than females, just over ¾ of all suburbs in Victoria actually. This reflects the higher rates of unmarried men in Australia described earlier.
Difference between ‘Never been married’ Males and Females

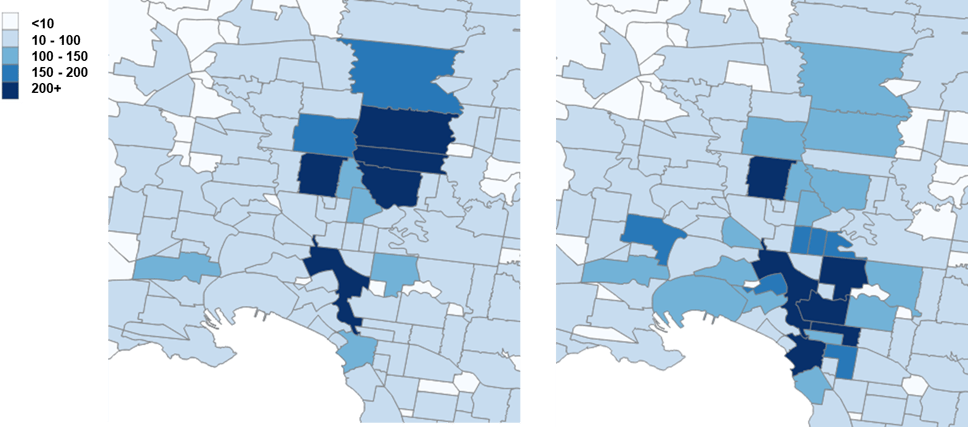
Mapping relationship statuses can also reveal the same sex relationship suburb clusters. Inner city suburbs such as Melbourne, St Kilda and Richmond have the highest number of same sex couples living together but there are different preferences across the city dependent on whether relationships are male or female. There is a clear preference amongst males for Melbourne’s inner south-east (St Kilda, Prahran, South Yarra) and amongst females for Melbourne’s north (Northcote, Thornbury, Preston).
Number of residents in same sex living arrangements
Females Males
There is much more to discover within the latest release of the 2016 Census. Stay tuned to .id’s blog for more interesting tales.

.id are population experts who analyse, enhance and present Census data through web applications and consulting services. You can access our free community population profiles online to see how the results from 2016 Australian Census relate to your local area.


