About 60% of Australia’s population growth in any given year is due to overseas migration. Australia has always been a country of migrants, and in 2011, almost 25% of Australia’s population was born overseas, with 43% either being born overseas or having at least one parent born overseas.
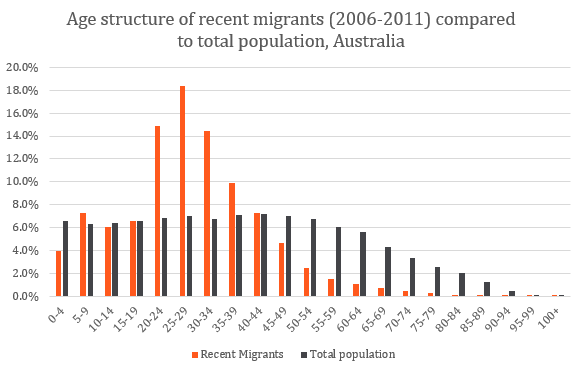
Population growth underpins the growth of housing and economic growth in Australia. Migration keeps the population young, as most migrants are clustered in the young working-age adult ranges, and can support the older population by paying taxes for many years.

So it is interesting to look at whether migrants own their own homes or rent, and where they do this.
Typically, migrants arrive in our capital cities, particularly Sydney and Melbourne, but increasingly Brisbane and Perth as well. The combined capital cities of Australia have 31% of their population born overseas.
The UK is the number one overseas birthplace, followed by New Zealand, and then China and India. Since World War II these next positions have been occupied by Italy and Greece but they have fallen substantially and Greek migrants fell out of the top 10 for the first time in 2011, replaced by Malaysia.
This table shows the top 20 increases in birthplace groups over the past 10 years (2004-2014). It shows a substantial shift in Australia’s migration, with a focus on Asian countries in recent years. It also shows the very high migration level we’ve had over the past decade.
Source: ABS, Migration, Australia, 3401.0
Note that a substantial part of Australia’s migration still comes from English speaking countries, for instance an increase of over 100,000 people from the UK just in the last 10 years. India is the top source of new migrants now, however.
The skilled migration program is the largest intake of migrants, followed by family reunion migration, and the humanitarian program (refugees) makes up about 10% in most years. Though often discussed in the media, asylum seekers have virtually no impact on Australia’s migration numbers.
The Census can show us the housing path taken by migrants as well.
In 2011, overseas-born populations in total were slightly MORE likely to be full home owners than Australian-born population (27.7% to 26.3%), due to the older age structure of many established migrant groups (meaning they had paid off their homes already). They were, however much LESS likely to have a mortgage (33.8% to 42.4%) and MORE likely to be renting (32.5% to 26.2%). So it appears that older migrants mainly own their own homes while younger ones are more likely to be renting. Brisbane’s migrant community was the most likely to be renting (37.5%), followed by Sydney (35.2%), while Perth’s migrants were the most likely to have a mortgage (38.5%). Generally migrants in regional areas (like the general population) were more often full home-owners, with regional Victoria’s migrant population having 39% full home ownership and regional Tasmania 42.6%.
However the pattern differs from country to country. The overseas countries of birth most likely to have a mortgage in 2011 were (Australian-born is shown for comparison):

Sri Lankan-born populations are most likely to have a mortgage in Australia. Their home ownership propensity is reflected in the areas they live, for instance the City of Casey in Victoria, a large first home buyer growth area on Melbourne’s south eastern fringe.
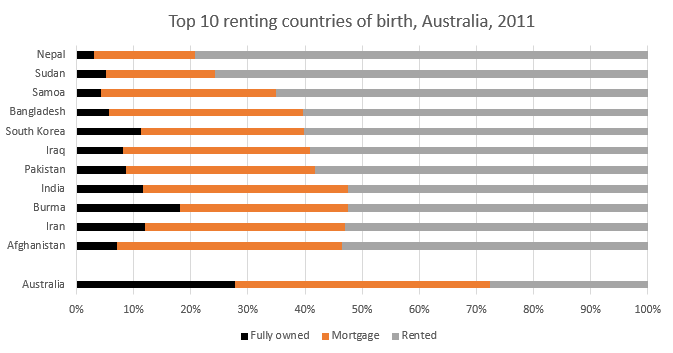
While those most likely to be renting were:

Renters are more likely to be young, so these countries represent those with the youngest age profile, most of them recently arrived, and are also very likely to be students. Around 80% of Australia’s population born in Nepal arrived between 2006 and 2011, and 28% were university or TAFE students.
These countries also had among the highest proportion of their population in high density housing (flats in 3 or more storey blocks). Nepal was the highest, at 38%, followed by Korea (29%), Japan (24%), Bangladesh and Indonesia (24%) and China (23%). This is reflective of both the age structure of migrants from these countries (relatively younger) and cultural preferences for higher density housing and living close to cities. Whereas the highest proportion of any nationality living in separate houses is those born in Australia (81.9%). This reflects Australians’ historic housing preferences, and also the predominance of Australian-born population in regional and rural areas which tend to have little higher density housing.
The countries of birth in the chart below showed the biggest increase in the numbers taking out mortgages, and hence the biggest increase in the percentage of their population living in mortgaged dwellings.

Source: 2006 and 2011 Census of Population and Housing, ABS, unpublished data.
These primarily represent countries of birth which showed a large increase in the late 1990s to early 2000s (some with substantial continued migration). It shows that migrants, like those born here, aspire to own their own homes, and after finding their feet in their new country, they do settle down and buy their dwellings.
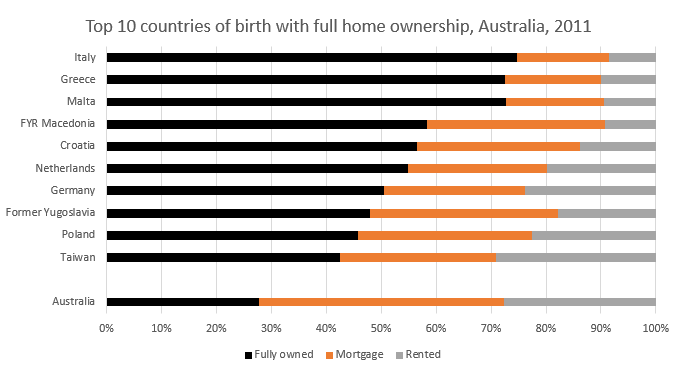
In contrast, those countries showing the highest rate of full home ownership (no mortgage) are almost all representative of the post WWII wave of European migration, with Italy topping the list – 68% of Italians fully own their homes.

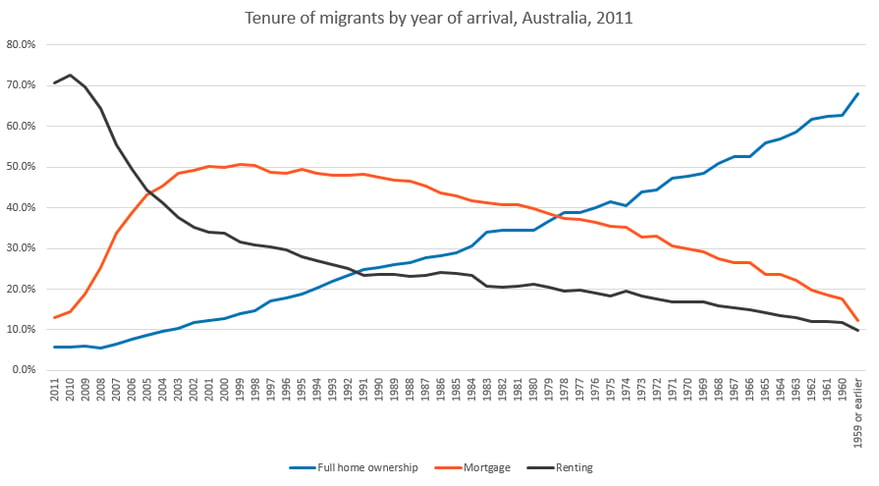
What all this shows is that home ownership among migrants, like those who were born here is highly correlated by age, and year of arrival in Australia. Newly arrived migrants generally rent for a few years until they become established, but then buy a house and pay it off.
The chart below shows it quite clearly (note that the most recent arrivals are on the left of the diagram) – the longer you have been in Australia, the more likely you are to fully own your own home. Mortgages start off very low, peak for migrants who have been here about 12 years (at just over 50%), then slowly drop as the home loan is paid off. Renting is most common at over 70% for the most recent migrants of the past 2-3 years, then drops off dramatically as they take-up mortgages.

Interestingly, the migrant year of arrival which is most similar to the “Australian-born” tenure profile is those who arrived in 1994, or people who have been here for 17 years at Census date.
Those who are renting tend to be the youngest and newest migrant groups, those with a mortgage are those who arrived 10-20 years ago, and those who have fully paid off their homes are the older, more established migrant groups. In this way the pattern of home ownership for migrants is very similar to those who were born here, with renting dominant among the young.


.png)


