100 years of population change in Tasmania
One of my favourite releases (OK there are many) from the ABS is the historical series of population data. After a bit of a hiatus the ABS released an updated series during 2014. This release contains a wealth of historical data on Australia’s population, everything from overseas migration to life expectancy. Recently, Esther, Glenn, Scott, Georgia and I attended the APA Conference in Hobart. While the conference wasn’t specifically about Tasmania’s population, it did provide an opportunity for many presenters to weave Tasmanian population data into their presentations. There are many interesting facets with regards to demographic change in Tasmania, but I thought I’d delve into history here and use the ABS data to show how much Tasmania’s population has changed.
Tasmania has a lot in common with rural Australia
Tasmania is one of the slowest growing states in Australia and sometimes barely makes it into positive figures. In fact for part of the 1990s Tasmania was losing population. The APA Conference coincided with the release of the Tasmanian population projections by their State Treasury department. Like many State government forecasts data are presented for different series, with the outcome of the high series assumptions being somewhat optimistic. Demograhically, Tasmania has some very real challenges in the future, with ageing populations and low growth rates. Presentations by respected demographers Natalie Jackson and Lisa Denny showed us evidence that Tasmania has a migration profile much like that of regional Australia ie it loses young adults, and this facilitates ageing of the population. Natalie Jackson rightly argues that places that grow through population ageing do not have the momentum for future population growth through natural increase because the population will reach a tipping point whereby deaths outnumber births. Of course if you look at data for small areas there are many parts of Tasmania that do have more births than deaths, in conjunction with out migration of young people. These places face challenges with regard not only to service provision, but the very sustainability of small towns and villages.
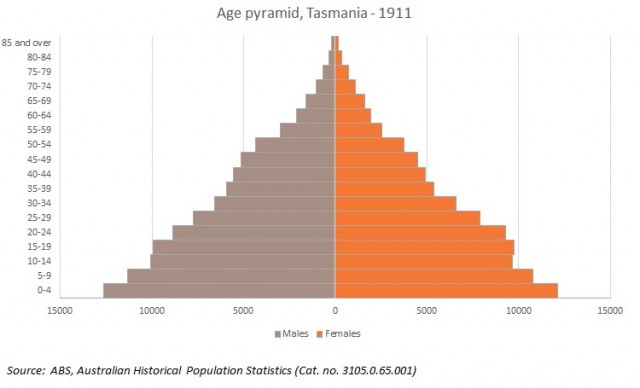
Tasmania in 1911
But it hasn’t always been this way. The chart below shows the age structure of Tasmania in 1911, when the population was 191,210. The shape reflects that of the classic population pyramid, with the bulk of the population in the younger age cohorts, and progressively fewer people in each cohort as age increases. High fertility combined with low life expectancy and higher mortality meant a large number of babies but not as many people made it to the upper end of the age spectrum. In 1911, almost half of the Tasmanian population was aged 0-19 years and less than 2.5% was aged over 70 years.
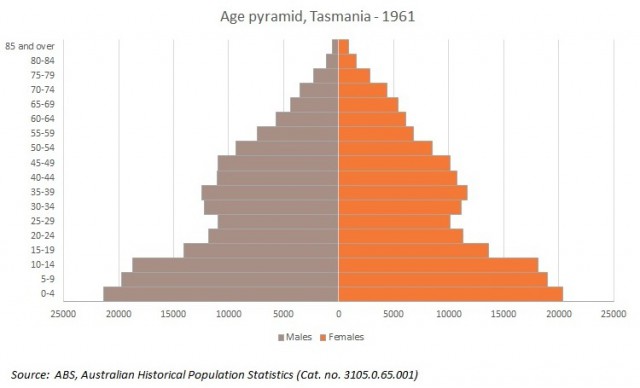
Tasmania in 1961
By 1961 the Tasmanian population had reached 350,000 and the age composition of the population had changed significantly. This was a time of peak fertility in Australia and you can see the impact of the post war baby boom at the bottom end of the age spectrum. But you can also see the impact of low fertility during the 1930s and 1940s on the population structure with a big “dint” in the pyramid. Dare I say the pyramid looks slightly vandalised? But it’s these people who were having children during the 1950s and 1960s. In 1961 the total fertility rate in Tasmania was an impressive 4.03, compared to 3.55 for Australia. Interestingly, even though there were almost twice as many 0-14 year olds in 1961 compared to 1911, they comprised a similar proportion of the population. This is because of increases in life expectancy and mortality in the previous half century that heralded the beginnings of population ageing, in that many more people were surviving through childhood years, into adulthood and beyond.
Tasmania in 2011
Fast forward another half century to the current era, and Tasmania’s population now stands at around 511,000. Our population pyramid is now pretty much a misnomer – I’ve heard many terms but “beehive” seems to be the most popular. The last 50 years have seen some very significant social shifts which have had profound demographic outcomes. Notably, fertility rates declined rapidly from the late 1960s, bottoming out in the early 2000s. Tasmania still has one of the highest fertility rates in the country but it has halved since 1961. Out migration of younger adults interstate and overseas can be seen by the smaller size of the 20-39 year old cohort. As most births occur to people in this age cohort it follows that even with a slightly higher fertility rate, there will be a lower number of babies born compared to a situation in which these net migration losses were not occurring.
The other major shift has been considerable ageing of the population through improved health outcomes that have resulted in very large numbers of people surviving to the upper end of the age spectrum. In 2011, more than 10% of the Tasmanian population was aged over 70 years, but it’s the volume that has really changed. In 1911, less than 5,000 people were aged 70 years and over, but the equivalent figure in 2011 was more than 56,200.

Of course the demographic trends that have been described here are not unique to Tasmania. The classic age “pyramid” does not really exist in Australia anymore (except maybe in outer suburban areas). Social and economic changes over the course of the twentieth century combined in many complex ways to influence demographic outcomes across Australia. The data presented in Australian Historical Population Statistics tells many stories and dispels many myths. What does the data say about your State?
Simone - Myth Buster
Simone has a rich background in human geography, demography and urban planning – a background that was useful in her previous roles in the Commonwealth and State Governments, and now as part of the forecast team at .id. From the Queensland coast to the southern suburbs of Perth, Simone produces population and dwelling forecasts that help local governments make informed decisions about future service and planning needs. She is a regular contributor to .id’s blog and has spoken at several conferences on how our cities and regions are changing. She is a big advocate of evidence-based planning and how Census and other data can inform this. Outside of work Simone is a keen traveller and photographer – interests that tie in well with her professional life and help her to understand “place”.


