Forecasting slow growing areas – the example of Burnside
Here at .id we provide population and dwelling forecasts to about 120 local governments across Australia. It’s a common misconception that all of these are rapidly growing areas – and many are – but a key use of population forecasts is understanding how communities will change in the future and what this means for service provision. All local councils, big or small, fast or slow growing, need this information as it provides the evidence base for the allocation of scarce resources. Our “bottoms up” approach to forecasting, whereby we consider small areas, typically shows great diversity across a council area. Futhermore, while the overall numbers may not change much, it’s the age and household composition that provide clues as to how an area is changing over time. The City of Burnside is a great example of a council where the headline population figure indicates slow growth, but the maturing of households and impacts on the age structure hold the key to understanding future service needs in this community.
Key facts
The City of Burnside is an established municipality in Adelaide’s eastern suburbs. Its early development has resulted in a low density urban form with a number of significant heritage areas. Medium and high density living is the exception here, with only a few high rise apartments towers located in the suburb of Glenside on the CBD fringe. In 2011, the population of Burnside was 44,092, and this is forecast to increase modestly to reach a population of 45,992 at 2036. Over the 25 years this represents an annual average growth rate of just 0.2%. Future growth and change in the City is largely influenced by a relative lack of strategic development sites as well as heritage and conservative overlays that constrain infill development in some areas.
Where will development occur?
The table below shows the assumed number of new dwellings and total population growth in each small area in the City over the forecast period. Clearly, Glenside – Eastwood has the most assumed dwellings. At the time the forecast was prepared, there was a masterplan being developed for the residential component of the former Glenside Hospital campus – regardless it is clear that some residential development will occur at some point in the future and this knowledge was incorporated into the forecast assumptions.
Source: forecast.id, prepared by .id the population experts for the City of Burnside, May 2015
Because of the lack of large development sites, the main driver of growth in the City will be incremental infill development. Though the totals are not high, most of this type of development is assumed to occur in Dulwich – Rose Park, Magill – Rosslyn Park and Linden Park – St Georges. Interesting, a lot of the change in dwellings is coming from knock down and replace of an older house, rather than dual occupancies and subdivisions. The knock down and replace does not result in an increase in dwellings, but it can result in a larger dwelling. In fact, between 2006 and 2011, the City of Burnside recorded a small decline in the number of two bedroom dwellings, and an increase in the number with four or more dwellings. This indicates that either people are extending their houses through renovation, or the knock down and replace process is resulting in houses with more bedrooms.
The other critical aspect of the population forecast is that even though additional dwellings are assumed in all small areas, it doesn’t necessarily translate to population growth. This is due to changes in household type, particularly as the population ages and households become smaller, for example, as children leave the family home, or through divorce or death. The most notable example in Burnside is the small ara of Hazelwood Park – Tusmore, where although an additional 64 dwellings are assumed in the forecast period, the population is expected to decline by 110 persons.
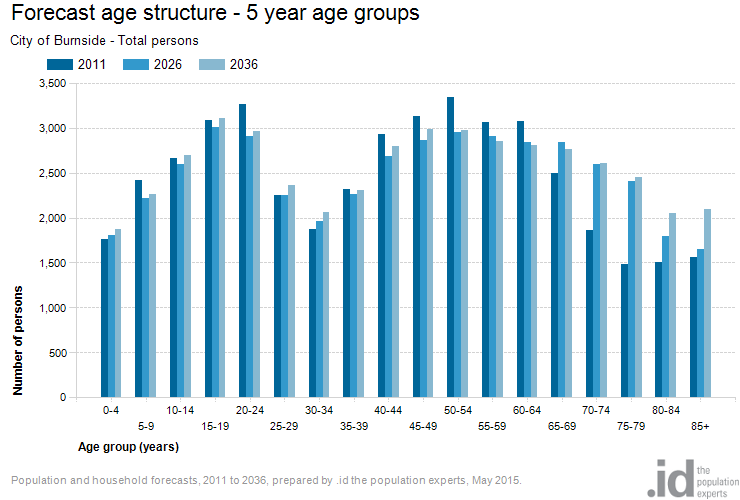
How will the age structure change?
The age structure of the City of Burnside out to 2036 is shown in the chart below. Mature families are attracted to Burnside due to the location of several prestigious private schools, so there is a net gain of families through migration in most areas. Burnside tends to lose young adults as they leave the family home, though in areas closer to the CBD such as Glenside – Eastwood there is a net gain, primarily students in rental accommodation. Overall, the age structure shows a maturation over time with increases in the number and proportion of elderly residents. In 2011, about 20% of Burnside’s population was aged 65 years and over, but by 2036 this is forecast to reach 26%. The number of persons aged 65 years and over increases by over one-third in the forecast period, whereas the number of children remains relatively stable. Over time, this population increase will translate into an increase in services demanded by elderly residents.
The spatial perspective
Although Burnside’s population may not grow much over the next 25 years, it’s clear that the age structure will. Moreover, the ageing that will occur differs across small areas, as shown in the map below. The map below shows the assumed growth in the population aged 65 years and over by small area.
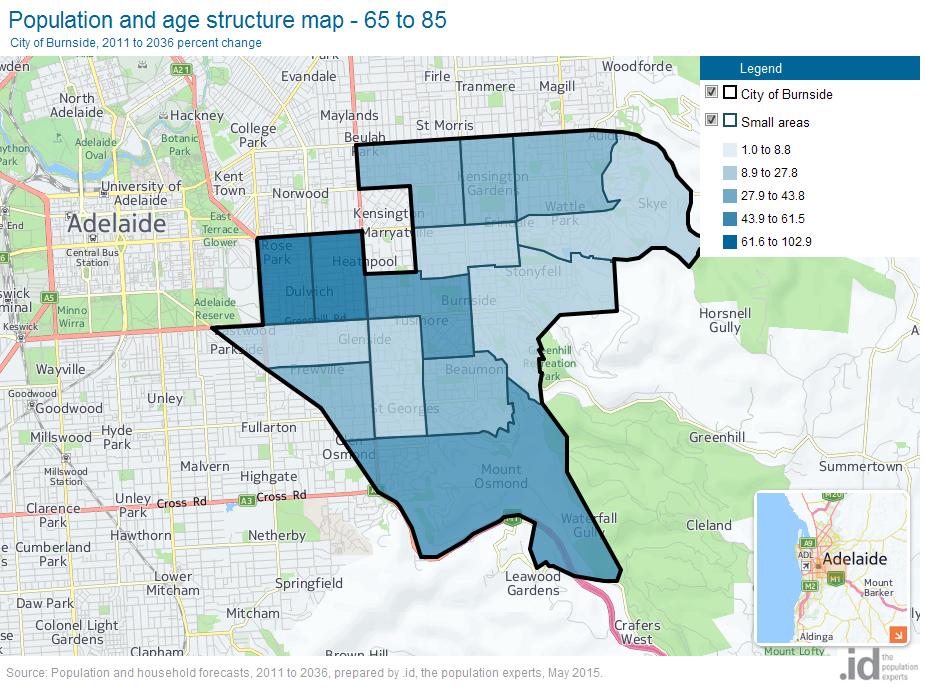
The darker areas indicate small areas where the largest increases in the 65 plus population will occur. The small areas of Dulwich Hill – Rose Park and Toorak Gardens are expected to record the highest growth over the 25 years. Urban areas evolve in different ways, meaning that the spatial differences need to be considered when allocating resources. Elderly people use different services to younger people and families, and they also use public spaces differently eg they are generally not users of playgrounds or skate parks. A key challenge for councils is how to manage their asset base over time as their population changes.
So it’s not all about fast growing areas….
This brief analysis of the City of Burnside’s forecast shows that even in slow growing councils, there is still a lot of internal momentum for population and household changes. Too often I have heard the comment that population forecasts are only useful for rapidly growing areas – and they are – but more often than not it is the way households change that determine the population outcomes. It is overlooked and not well understood. Even in rapidly growing councils there are often suburbs that have limited future growth opportunities – and it is important for councils to understand how and why this is happening. In addition, changes to the population age structure also result in changes in how people live in dwellings, and this can result in population decline even where there are more dwellings added to the stock. This is an era of scarce financial resources, and more power to the councils that understand how their populations are changing and using the evidence base to make their decisions.

Simone - Myth Buster
Simone has a rich background in human geography, demography and urban planning – a background that was useful in her previous roles in the Commonwealth and State Governments, and now as part of the forecast team at .id. From the Queensland coast to the southern suburbs of Perth, Simone produces population and dwelling forecasts that help local governments make informed decisions about future service and planning needs. She is a regular contributor to .id’s blog and has spoken at several conferences on how our cities and regions are changing. She is a big advocate of evidence-based planning and how Census and other data can inform this. Outside of work Simone is a keen traveller and photographer – interests that tie in well with her professional life and help her to understand “place”.


