The bare mention of the word “density” in relation to how Australian cities are changing is inevitably provocative. After all, the post war period of suburban development has been characterised by low density housing, and from a cultural perspective this is deeply ingrained. But as our cities continue to grow outwards the problems of urban sprawl have become apparent. Successive state government policies around metropolitan planning have tried to curb this through intensification policies. However the increasing number and scale of high density developments, usually in the form of multi storey apartments, have created some community backlash and angst. The application of new planning zones in Victoria earlier this year has again put focus on increased densities in Melbourne’s suburban areas. Generally, the three new residential zones permit different density types and this has lead to a fear that some areas will be overrun with high density apartments. But what exactly does this mean, and what does high density look like?
How is density measured?
There are many ways in which dwelling density is measured, and is so often the case there are a number of ways in which this can be expressed. In this blog, I’m going to look at the numeric and the visual. For example, do you know what 15 dwellings per hectare looks like? This is often considered to be standard density in a contemporary greenfield development, but what does it look like? What about 50, or 100 – or for that matter, let’s ramp it up a bit – what does 500 dwellings per hectare look like?
When measuring density, it’s important to know whether you’re referring to gross or net density. In an urban setting, the former considers the entire area, including all types of land uses. The latter refers only to specific areas, so if you’re measuring housing, the measurement will exclude non-residential land uses. Both measures have their uses but for the purposes this blog, I’m going to use gross density.
Considering the visual
Over the years .id has undertaken housing work for a number of metropolitan councils across Australia. Housing .id is an analysis of housing consumption patterns and housing capacity across a local government area. It considers the current urban form, known development sites, and we work with urban planning staff at council to determine possible housing capacity in and around their activity centres. It’s a powerful tool for looking at possible urban futures. As part of the process we use photographs to demonstrate what intensification entails, and we’ve found that this has quite a strong impact.
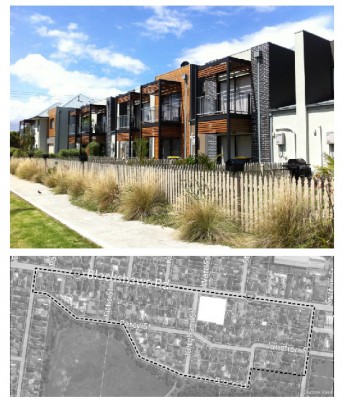
The figure below shows a recent development in Melbourne and how it compares to the surrounding area in terms of its density. Newport West is located in Hobsons Bay City Council, around 12km west of the CBD. The area in question contains a mix of period homes and post war development, but is primarily low density in nature. In fact, as the diagram shows, the density of the SA1 (the ABS geographic spatial unit) is just 16 dwellings per hectare. The townhouse development on Blackshaws Road, comprising 18 dwellings, is approximately 50 dwellings per hectare. Though this is around three times the density of the surrounding area the overall impact in terms of scale and amenity is quite low.

Source: .id (2012), Google Earth (2011), ABS, Census of Population and Housing (2011)
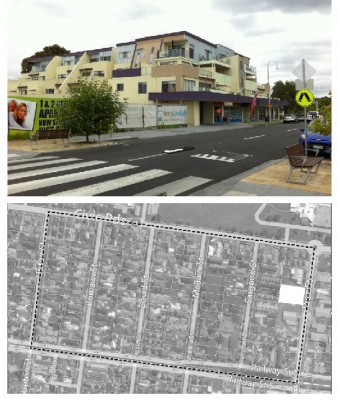
The photo below shows another example from Hobsons Bay, but this one is located in Pier Street Altona. Pier Street is undergoing a considerable amount of change with at least three multi storey apartment buildings constructed in recent years, with more proposed for the future. Most of these are replacing underutilised land north of the railway station, making these sites strong candidates for urban intensification. The apartment building in the picture has a density of 110 dwellings per hectare, compared to 15 dwellings per hectare for the SA1. The higher density of this site obviously has a greater impact on the surrounding neighbourhood, but the building itself is only four storeys high.

Source: .id (2012), Google Earth (2011), ABS, Census of Population and Housing (2011)
Note that since this photo was taken at the beginning of 2012, an apartment building on the vacant block on the left has been constructed. This is a similar height but has a site density of around 200 dwellings per hectare. These types of locations are perfect for intensification as they are located near public transport, shops and services, and on a metropolitan scale, are relatively close to the CBD. In fact, much of Altona is undergoing rapid change as the ageing dwelling stock on larger blocks is being replaced by small scale villa units and townhouse developments.
This is a very simple way of demonstrating what density looks like. Of course there are much larger apartment buildings in and around the CBD but I deliberately chose examples from suburban areas as it is these kinds of developments that appear to cause the most angst. These examples demonstrate that significant gains in residential density can be achieved through relatively low scale infill developments and apartment buildings of three or four storeys without massive impact on the surrounding areas. All things being equal, planning zones are a tool by which decisions are made about future land use, and the election of a new State government in Victoria at the end of November 2014 may see the new planning zones come under review. At .id we are interesting in the many and varied ways of how our cities are evolving and changing. We believe that intensification of housing in established parts of our cities is good policy where it is well planned and promotes sustainability of communities and housing choice.


