I’m not one of those “stoic kiwis” who happily skips through freezing winters in a cold house. I grumble and moan through the cold months, mummified in multiple layers of clothing, promising myself tropical holidays – long ones.
However, my misery will be a thing of the past next winter after recently purchasing a glamorous Italian woodburner. Mr Italy promises to rectify all my heating woes, provide unlimited hot water and cook my meals. My husband and his chainsaw are in perpetual motion preparing for next winter. He’s so happy (what is it with guys and chainsaws?) though no tree on our property is safe.
With images of a glowing t-shirted me in the depths of next winter, padding barefoot around my house, happily lingering in previously frigidly inhospitable hallways and bedrooms, I am happy too. So it was with avid interest that I explored one of the most recent dataset additions to the New Zealand profile – household fuel types. I wanted to see what everyone else is up to in home heating.
Household fuel type indicates the types of fuel used in occupied private dwellings only, for heating purposes only (excludes cooking etc.). It is a multi-response question, so respondents can select several (that means the total of responses will sum to greater than the total population). There is no indication of the preference of fuel type used within a multiple response, or how long or how often any particular fuel type is used.
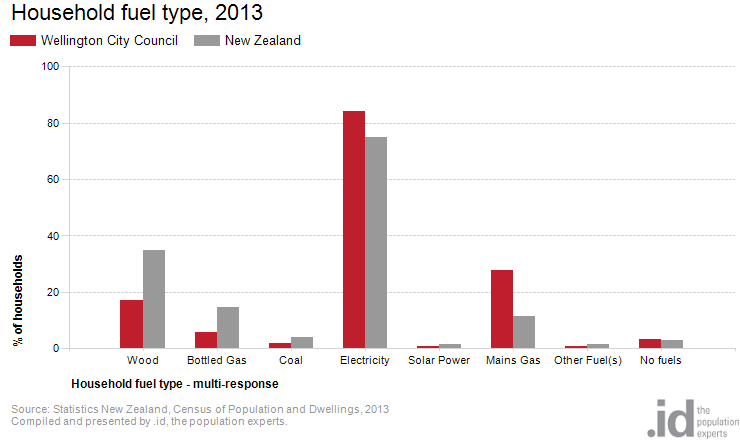
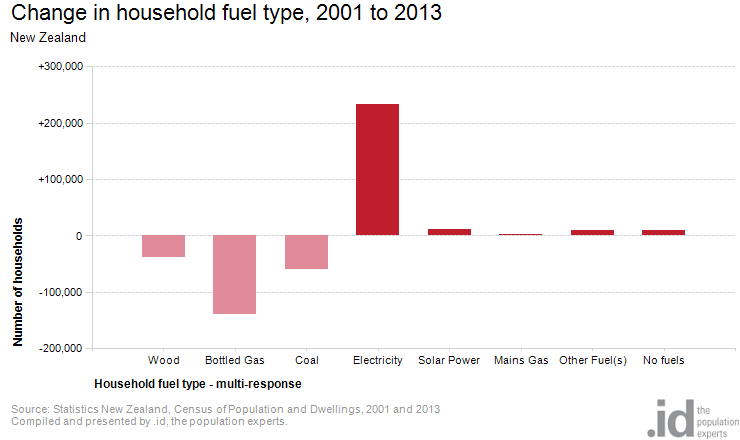
Bearing in mind that household numbers rose by 95,715 between 2006 and 2013, here’s a snapshot of Wellington benchmarked to New Zealand in 2013. The change in household fuel types over three censuses follows. To find your TA’s results for home heating, visit our New Zealand Demographic Indicators site.


I expected to see the rise in solar power with the technical advances made in this field in the last decade and across the regions large variances in fuel preferences due to climate (see below) were no surprise. But I didn’t expect to see the rise in electricity users that occurred (a confounding result) and the massive decline of bottled gas – I touch on each of these findings below.
Solar power
Solar power experienced a large increase in popularity. Actual numbers are still modest but while 23,214 households (1.5%) could boast solar splendidness in 2013, that was 8,244 more households than in 2006 and almost double the 12,141 solar households of 2001.
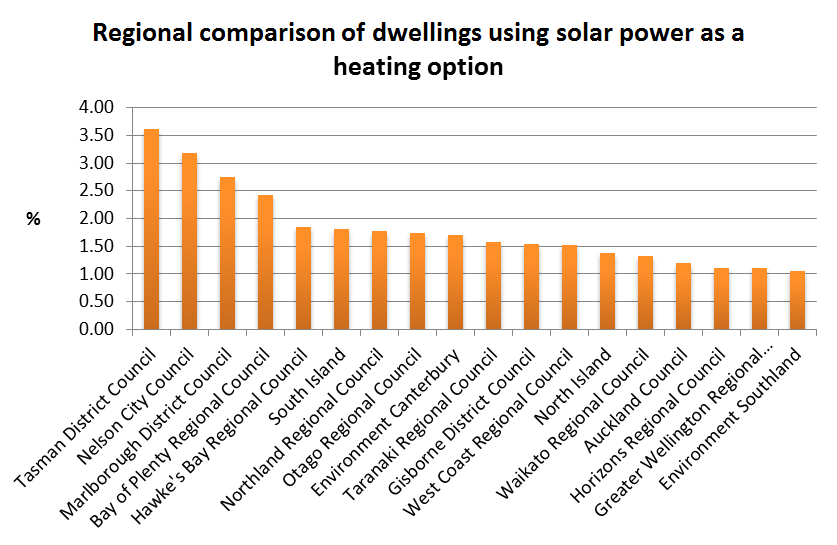
Which areas where the big adopters? The sunny Top of the South (Tasman, Nelson and Marlborough) is leading the way with solar households, and interestingly the South Island has a higher percentage of solar dwellings than the North (1.8% c.f. 1.38%).

Regional variations in fuel preferences
A comparison of regions across the length of New Zealand makes for interesting reading. There is a much heavier reliance on wood as a heating option in the South Island with Otago leading the way, and while all four regions showed an ongoing trend of declining wood use to heat homes, Otago registered the lowest percentage decline moving from 60.5% in 2001 to 54.14% in 2013. Of the four regions profiled here, Canterbury recorded the largest percentage decrease in wood using households moving from 49.6% in 2001 to 37.3% in 2013 – a 25% decrease.
Table 1. Comparison of fuels used for home heating in four regional councils
Bottled gas
What’s up with bottled gas? This option was used by over a quarter of New Zealand back in 2001 (365,400 households equating to 27.2%). In 2006, the absolute number rose slightly to 385,761 but proportionately decreased to 26.5% . This might have been a harbinger for future trends because figures have since plunged. In 2013 only 226,311 households used bottled gas as a heating option (just 14.6%). Perhaps it has been a case of bottled gas costs rising, or a seductive argument made by sporting stars Stephen Fleming and Dan Carter in the heat pump ads. Cool in the off-season …..mmmm.

Electricity
I said I was confounded by the increase in electricity usage and I am also a little outraged. It’s just that electricity costs have risen massively. My monthly electricity bill is a sobering experience. Consumer echo my consternation noting that electricity has gone up in real terms by 46% since 2000 (https://www.consumer.org.nz/articles/electricity-prices).
While households account for about a third of the electricity consumed in New Zealand, according to Consumer they shoulder most of the price rises. Low-income households feel the most impact as these households spend a large proportion of their income (around 10 percent) on energy.
There is also the question of reliability with electricity. The last decade has been punctuated by many emergencies (floods, wind, snow storms and of course earthquakes). Thousands of households have found themselves without power for extended periods. Yet, while the vulnerability of households relying solely on electricity is regularly exposed, it seems lessons are not being heeded. Electricity looks set to further cement its place as the leading choice for household heating.
While this blog focuses on national trends, there are big regional variations which you can find by visiting the New Zealand Demographic Indicators site.


