Birth numbers remain high
The ABS has recently released its annual data on births in Australia, which contains detailed information on just about every aspect of fertility – number of births, rates, age specific rates, median age of parents – you name it, there’s a wealth of interesting data in this publication. As we’ve blogged previously, the release of this data gives us up to date information about fertility trends in Australia, particularly at small levels of geography such as LGAs. What are the highlights of this year’s release?
National and State trends
The number of births registered in Australia in 2013 was 308,065, slightly less than the 2012 figure of 309,582. Since 2008, the number of births registered in Australia has been greater than 300,000. There is certainly a much larger cohort of young children moving into and through the age spectrum. To put the size of this young cohort into perspective, there were 1.524 million births in Australia in the five years ended 2013, compared to 1.384 million for the five years ended 2008.
At the State level, NSW recorded more than 100,000 births for the third time since 2008 – the number of registered births in 2013 was a 2% increase on the 2012 number. Conversely, in Victoria the number of births declined by more than 4%, from 77,405 in 2012 to 73,969 in 2013. An article in The Age appeared to take a doom and gloom angle, focusing on this decline and the low TFR, but even a quick glance at the numbers indicates that the overall number of births are still very high. Victoria has recorded more than 70,000 births each year since 2007 so there are still a large cohort of young children. They have started to impact on school enrolment numbers and will continue to do so, even though Victoria’s TFR is the lowest in the country.
Rapid population in Western Australia has also reflected the high number of births registered in that State. In 2013 there were 34,516 births – the highest number ever recorded in a year. Since 2008 there have been more than 30,000 births recorded in WA each year and the number is slowly creeping upwards. The ACT also recorded a record number of births in 2013, but of course the number was much lower (5,545). Regardless there has been more than 5,000 births registered per annum in the ACT since 2010.
Fertility rates
Though the number of births is important from a service planning perspective, it’s the total fertility rate (TFR) that is important to consider as it effectively measures the propensity of women to have children. The TFR is the number of babies a woman can expect to have in her reproductive life – generally 15-49 years. In 2013, the TFR for Australia was 1.882, which is the lowest rate recorded since 2006. The article in The Age referred to above seem to imply that the TFR was falling as economic conditions were declining, but please – some perspective people. Though the TFR did decline somewhat in 2013, as discussed above, there is still a very high number of births in Australia. Rates are important but they measure propensity, and if the pool of reproductive age women is high, then the number of births will also be high despite small movements in the TFR. The reality is that Australia’s TFR has been below replacement level (2.1) since the 1970s – we came close to reaching that benchmark in 2008 when the TFR was 2.023, but of course it has slipped back slightly since then.
Historically, Victoria and the ACT tend to have the lowest TFRs. However, the decline in the number of births in Victoria, coupled with a slight rise in the ACT, meant that in 2013 Victoria recorded the lowest TFR in Australia (1.756). At the other end of the spectrum, the NT tends to have the highest TFR on account of the higher fertility recorded by Indigenous women. In 2013, the TFR recorded in the NT was 2.117 and it remains the only State or Territory to have a TFR above replacement level.
In all States and Territories, TFRs were lower in the capitals and the lowest rates were recorded in inner city areas. The SA4s of Melbourne – Inner and Sydney – City and Inner South recorded the lowest TFRs in the country (1.2). This is on a par with the very low TFRs recorded in countries such as Japan and Italy.
The shift from young to older mothers
One of the trends in fertility in recent decades is the rise of the older mother, as reflected in an increase in the median age of mothers (and fathers), as well as changes in the age-specific fertility rate (ASFR). This measures the number of births per 1,000 population. The chart below shows the change in the ASFR over the last 80 years. Changes in the rates generally correspond with changes in overall fertility, but there are distinct differences in patterns of fertility when age is considered. In 2013, women aged 30-34 recorded the highest ASFR (124.5 babies per 1,000 women), followed by women aged 25-29 (99.5) and 35-39 year olds (70.8).
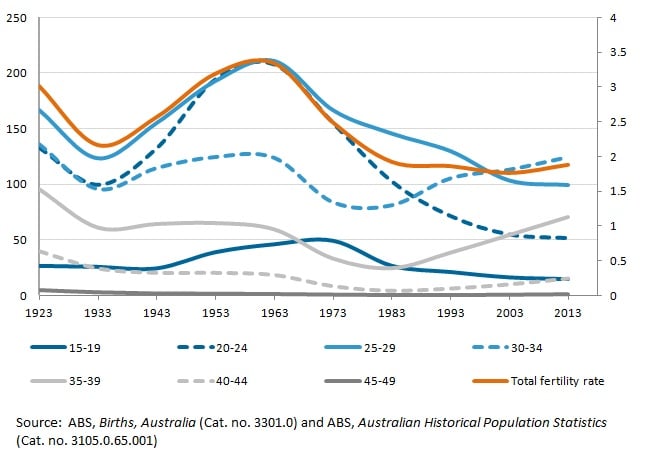
Peak fertility occurred in Australia in the early 1960s when the TFR was above 3.0. Women in their twenties had very high ASFR (more than 200 per 1,000 women) – more than double that of women in their early thirties. In fact, women aged 15-29 years recorded their highest fertility at this time. Since the 1970s the ASFR of younger women have declined – particularly for women in their early 20s. In 1963, 20-24 year olds had an ASFR of 208.2, but this declined to 102.7 in 1983 and stood at 51.6 in 2013. Interestingly, teenage mothers have always had relatively low age-specific fertility, but also recorded the highest rates in the 1960s and 1970s. In 1973 it stood at 49.1, but was just 26.6 in 1983, and has since declined to 14.6. This is actually on par with the ASFR of 40-44 year olds. So much for those radio shock jocks and their ilk suggesting the welfare system is being over run by teenage mothers, but the evidence is clear.
Much has been written about increases in fertility amongst older women, but overall it is still very low. In fact, when you look at the rates recorded over the last 80 years, there have been periods when the ASFR of women aged over 40 has been higher than it is currently. For example, women aged 45-49 recorded an ASFR of 4.5 in 1923, but this declined gradually to 0.6 in 1973, and has increased marginally to 0.9 in 2013.
However, as always, rates only inform the propensity side of the story and it’s useful to look at the number of births born to women in each cohort. ASFRs may suggest only marginal increases in the fertility of 45-49 year old women, but the number of babies born to these women has doubled since 2003. In comparison the number of babies born to teenage mothers has remained relatively stable in the last 10 years at around 10-11,000 births per annum.
How does .id use data on births in our forecasts?
The release of this data allows .id’s forecasters to include the latest data on births in their thinking around assumptions on future levels of fertility. It was only a few years ago that many forecasters (including those in government) thought that fertility rates would continue to increase, but the evidence now shows that the TFR has largely stabilised and may even be declining. The increasing number of births is more a function of the age structure of the population, as the pool of reproductive women is increased through high levels of overseas migration, and there is also evidence to suggest that some of the recent increase is attributable to delayed births ie more older mothers. In terms of the population forecasts we prepare for our local government clients, the release of this data provides another piece of the data jigsaw we work with in order to come up with transparent assumptions.

Simone - Myth Buster
Simone has a rich background in human geography, demography and urban planning – a background that was useful in her previous roles in the Commonwealth and State Governments, and now as part of the forecast team at .id. From the Queensland coast to the southern suburbs of Perth, Simone produces population and dwelling forecasts that help local governments make informed decisions about future service and planning needs. She is a regular contributor to .id’s blog and has spoken at several conferences on how our cities and regions are changing. She is a big advocate of evidence-based planning and how Census and other data can inform this. Outside of work Simone is a keen traveller and photographer – interests that tie in well with her professional life and help her to understand “place”.


