Population forecasters: What were they thinking?
How did the population forecasters of last century think that Australia’s population would change and grow?
.jpg)
The Australian Bureau of Statistics published their first population projections in 1950, with a 25-year horizon, these were not official forecasts however, they were prepared for the Queensland Royal Commission on the Sugar Industry and the publication states “they are to be referred to as hypothetical calculations”.
In 1978 the ABS prepared population projections out to 2011, they projected that in 2011 the population of Australia would be 19,580,700.
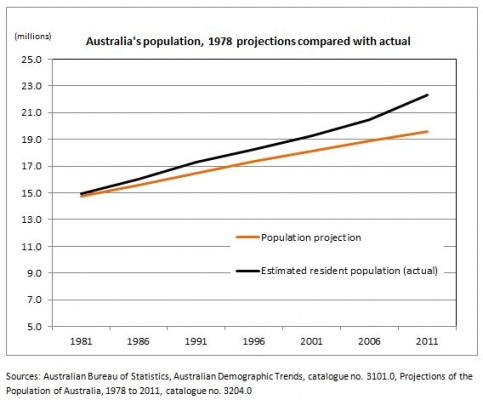
In 2011 the official population of Australia was 22,340,000, that’s a difference of 14%. What I think is interesting, apart from the fact that they were produced without computers (!), is how different the assumptions about how the population would grow were from what actually happened.
Assumptions about the number of births, deaths and migration are key inputs to all population forecast modeling, the age at which people undertake these events is also important to know (I mean, model) as the age-specific fertility rates, mortality rates and migration levels affects the size and composition of the population.
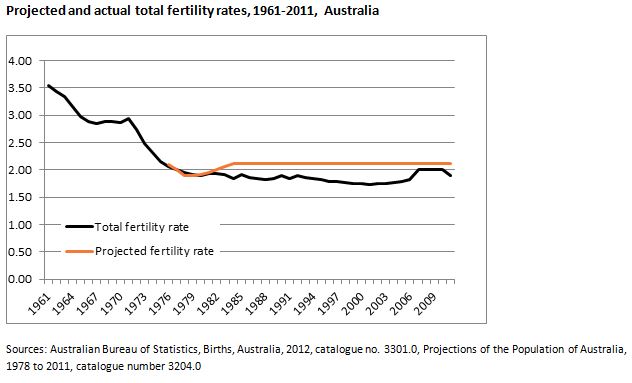
Forecasters of all persuasions generally develop assumptions about the future, based on the recent past. In 1978 for example, when the national fertility rate was 1.9 down from a high of 3.5 in 1961, the ABS projected future fertility rates of 2.11 per woman of child-bearing age from 1984 onwards. With the benefit of hindsight (and official statistics!) we now know that the fertility rate has been much lower than 2.11, in fact, it hasn’t reached 2.11 in that whole period.
In spite of having a lower than projected total fertility rate the level of natural increase (excess of births over deaths) has been higher than projected – how is this possible?
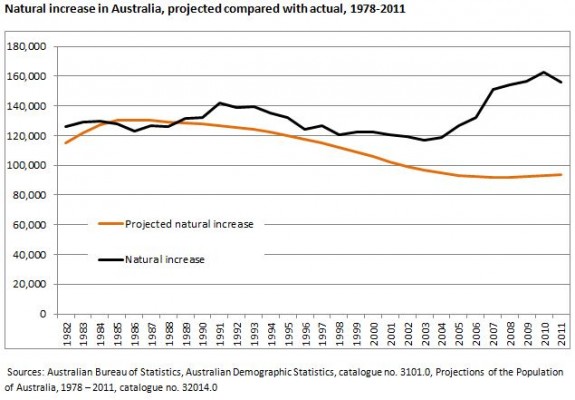
A combination of fewer deaths and a higher level of migration (including of those of child-bearing ages) has resulted in a much higher natural increase than projected. It may sound like a contradiction that the fertility rate was lower than expected but there were more than ever babies born in Australia, what it shows is that there are more women in the child bearing ages than forecast, but that on average, they had fewer babies.

Looking at past population projections is an interesting undertaking for us forecasters as it illuminates the assumptions about how Australia’s population was expected to change. Simone’s blog Assumptions vs predictions – the science of forecasting explains that a good forecast will have assumptions that have their basis in reality e.g. by considering the evidence base. The way we treat fertility rates for example is to examine recent trends, particularly at smaller levels of geography, and make a determination as to their likely direction in the future. This is true of the forecasters of last century too.
This examination of the past forecasts shows the importance of regular monitoring and updating of assumptions about the factors of population change. At .id we are immersed in that data, and reading our blogs is one way to stay up to date with our understanding of how Australia’s population is changing now and how we expect this to play out in the longer term, especially at the local level such as individual suburbs and neighbourhoods.
For more population forecasts of Australia, visit our demographic resource centre. If you would like learn more about population forecasting, visit our website or contact us via email. You may also wish to sign up to our newsletter to receive the latest population and demographic insights of Australia.
![]()
Esther - Team Forecast
Esther joined .id after working in the demography teams at both Statistics New Zealand and the Australian Bureau of Statistics producing national and regional statistics. Esther produces the top-down model for .id’s SAFi (Small Area Forecast information). This involves synthesising overseas, interstate and regional migration patterns to quantify regional change. Esther loves the way statistics assist in understanding our communities and can dispell urban myths or stereotypes.