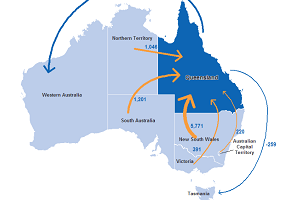
When it comes to net interstate migration in Australia, all States and Territories tend to lose to Queensland, with New South Wales having the greatest loss. Victoria and New South Wales traditionally lose large numbers to other States, although the net change to and from Victoria has been relatively minor over the last ten years. Will this pattern continue in the future?

Net interstate migration gains and losses between States tend to reflect a range of economic and lifestyle factors. These include:
- Relative economic performance and relative employment prospects of each State
- Lifestyle and environmental factors (people within Australia have tended to move to the so-called ‘Sunrise-States’, namely Queensland and Western Australia)
- Mining booms (greatest influence in Western Australia)
- Financial position of the Commonwealth budget, which affects the growth prospects for the Australian Capital Territory
- Border issues, where housing and population growth is along a State or Territory boundary. Examples include Gold Coast-Tweed, Albury-Wodonga and Canberra-Queanbeyan
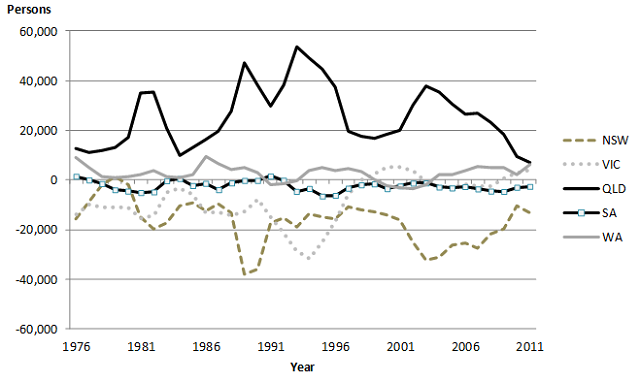
As the chart below shows, Queensland is the major beneficiary of net interstate migration in Australia, although its net gain has reduced considerably in recent years. Despite the enormous investment in Western Australia, net interstate migration gain is still surprisingly low. Large net losses from Victoria in the mid 1990s and NSW in the early 2000s have turned around significantly, while South Australia tends to lose, in net terms, a small but relatively consistent number of persons to other states.
Net interstate migration, major states, 1976-2011

Source: ABS, Australian Demographic Statistics, various editions (Cat. No. 3101.0)
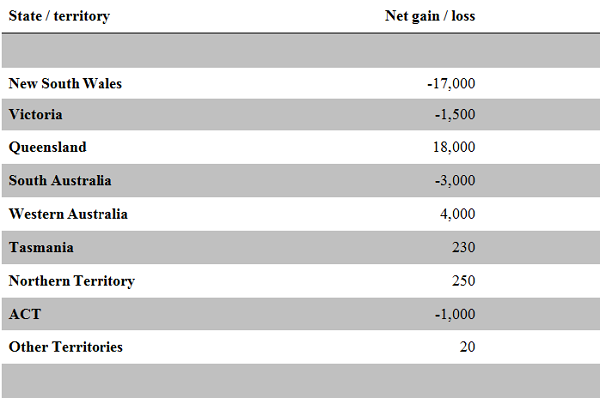
When we do our population forecasting work, we have to make assumptions about the future of interstate migration. The assumptions that .id has adopted in our tops-down forecast (SAFi – Small Area Forecast information) for net interstate migration by State tend to reflect the last ten year period. In some cases, this pattern is not currently reflected in the data, but is a compromise position, given that some trends have reversed in recent years. These include the total net interstate migration gain and loss to and from Queensland and New South Wales respectively. It is also worth noting that the gain to Western Australia through interstate migration has been remarkably modest, given the mining boom over the last five years. These figures are subject to change as more information becomes available. The latest model features the figures below:
Assumed net migration, States and Territories, 2010-2036

For the most recent population figures for your area contact the population experts at .id (03) 9417-2205 or info@id.com.au. And do follow us on Twitter @dotid or check out our website at id.com.au for more information about population change in Australia.


