At .id we are keen users of Census data and are eagerly anticipating the release of 2011 data in June. However, it’s not as if the ABS sits around twiddling its thumbs in non-Census years – they have an active demography program with regular releases to keep the Australian public, business and governments information of the latest trends. We use a lot of this data at .id in our products and services. What are some of the more important releases, what information do they contain, and where can I find them?
But can’t I just use the Census figure?
The regular population estimates produced by the ABS are just that – estimates. They are produced using a variety of external sources and statistical modelling techniques. What a lot of people don’t realise is that the Estimate Resident Population (ERP) is the official measure, therefore it is more correct to state the ERP figure rather than the Census figure. However, you need to conduct a Census first as the basis for producing the estimates, because the five yearly count is the most thorough method for counting the entire population. Every five years the ABS not only runs a Census, but they rebase the ERP estimates. Current ERPs are based on the 2006 Census and modelled forward, however, after the initial release of 2011 Census data in June the ABS will retrospectively review their estimates for 2007 onwards and adjust accordingly.
Australian Demographic Statistics
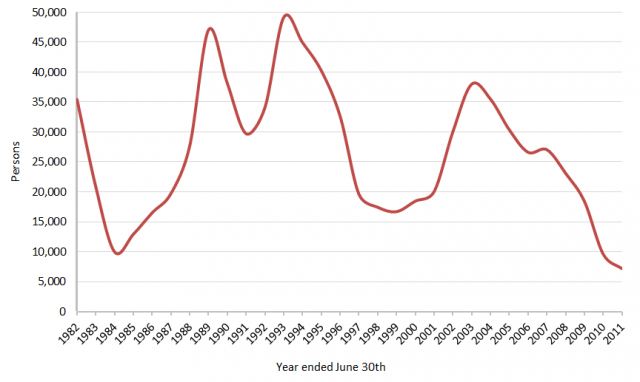
Possibly the most important demographic release is the quarterly publication, Australian demographic statistics (Cat. No. 3101.0). This is a major economic release which contains population estimates for States and Territories as well as the country as a whole. The latest publication was released in December 2011 and provided estimates for June 2011. As published in an earlier blog, at June 2011 the population of Australia was 22,620,600, an increase of 1.4% on the previous year. Aside from population estimates, Australian demographic statistics also provides data on the components of population change (births and deaths, overseas and interstate migration), population age structure and estimates of the Indigenous population. In addition to the publication itself, there are numerous time series spreadsheets and data cubes which provide more detailed data (select the “download” tab). For instance, the spreadsheet on components of population change confirms the volatile nature of interstate migration over time. Queensland is often cited as a state growing rapidly on the back of high levels of net interstate migration, but the graph below shows the volatile nature of this trend.
Net interstate migration, Queensland – 1982 – 2011

Source: ABS, Australian Demographic Statistics (Cat. No. 3101.0)
Regional Population Growth
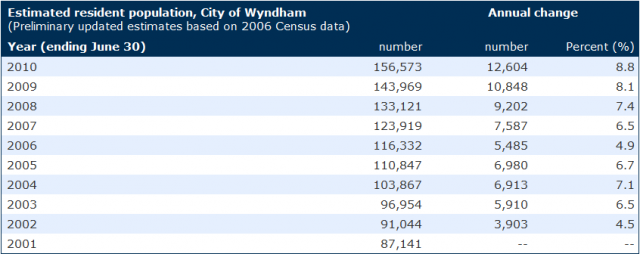
Another important release is the annual Regional Population Growth (Cat. No. 3218.0), which publishes estimates of population for sub-state geographies, including Local Government Areas. The richness of the geographic detail in this release enables a significant amount of spatial analysis to be undertaken. This has been written about in a previous blog, but the ABS also publishes a lot of maps on their website using this data. You can also create your own maps by downloading the spreadsheets. The current population estimates used in profile.id are sourced from this publication (see “current population estimates” on the menu to access population estimates from 2001-2010). The latest data from this publication confirms that Wyndham City Council recorded the highest population growth rate in Australia during 2009-2010 (8.8%). Furthermore, both the volume and growth rate have generally increased each year over the last decade, as shown in the table below.

Source: ABS, Regional Population Growth (Cat. No. 3218.0), as published in profile.id
Other regular population releases by the ABS include –
There are several less regular releases, such as Population Projections, Australia (3222.0), which contains projections for States and Territories using high, medium and low assumptions as well as a regular newsletter, Demography News (Cat. No. 3106.0). Several information and working papers concentrating on specific population issues, as well as one-off surveys, are also published on the ABS website.
For the uninitiated, the ABS website can be a daunting prospect due to the large amount of information published. In addition to the links, I have included the ABS Catalogue number here for reference purposes (as an aside, it’s always worth quoting the catalogue number and publication name when using ABS data in a report or other document ). From the ABS home page (www.abs.gov.au), most users tend to select the statistics option from the side or top menu, but where do you go from there? Because I’m an experienced ABS user, I tend to use the catalogue number option because for me that’s the quickest way to get the information I need. But that doesn’t work for everyone, so another option is to use the topic option (from which you can select population/people), or if you happen to know the date the publication was released, you can use the release data option. The ABS has also compiled a list of their most popular statistics which also contains links to the two publications I’ve discussed above.
Finally, it’s all very well to know what and how often these data are released, but how do you find out when? The ABS produces a release calendar which can be accessed from the home page, but release dates for a specific publication can also be found in the Past and Future Releases tab. In the case of Regional Population Growth, this indicates the next release date is 30th March 2012. Will Wyndham retain its position as Australia’s fastest growing LGA? Watch this space!
If you would like to receive more updates about demographic or economic trends, do follow us on twitter @dotid or subscribe to our blog (above). You may also like to visit us at id.com.au


