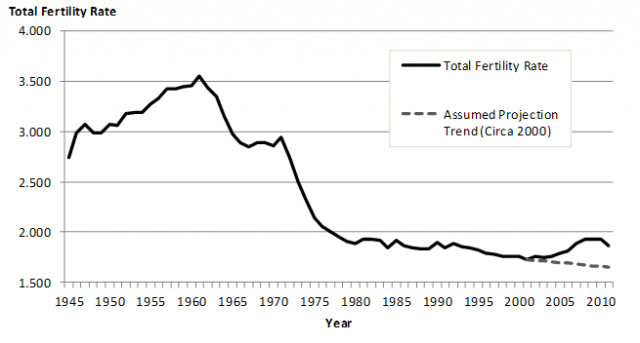
Fertility trends have changed considerably in Australia over the last decade. Australia’s fertility rate had been falling steadily since the baby boom of the immediate post World War Two period. Many developed nations of the world (such as Germany, Italy, Japan, Canada and Korea) have low or very low fertility rates, in most cases well below the replacement level of 2.1 babies per fertile woman and notably lower than Australia. The dominant thinking of demographers was that Australia would follow this trend and could have a fertility rate in the range of 1.5 or 1.6 babies per fertile woman by 2016. However, fertility rates have increased in most parts of Australia since about 2002, which has radically challenged this perspective.

Total fertility rate, Australia, 1945-2011

Source: ABS, Australian Historical Population Statistics, 2008 (Cat. No. 3105.0.65.001); ; Source: ABS, Australian Demographic Statistics, various editions (Cat. No. 3101.0)
The reasons for this up-swing in fertility rates are strongly debated. The reasons include:
- Favourable economic conditions including low unemployment rates, leading to more flexible working conditions allowing parents to balance home and work obligations (important for middle and high income families)
- Government income support including the baby bonus and family tax benefits (important for middle and lower income families)
- A new social paradigm, with greater gender equality and greater emphasis on supporting parenting by fathers
- Delayed fertility in a large cohort of women leading to higher rates for a period of time (rates likely to decrease in the coming years again)
The fertility rate assumptions adopted in .id’s work reflects the uncertainty of the longer term historical period versus the last 5-10 years. In .id’s tops-down population forecasts (SAFi) for Australia, the fertility rate is expected to peak in the current period 2008-10 at just over 2.0 babies per fertile mother for Australia and then fall moderately to about 1.84 by 2036. Our figures vary slightly from those published by the ABS above. As the chart also shows, the ABS estimates that there has already been a downward shift in 2011 after 7 or 8 years of upward movement, which is in line with the .id assumptions.
Nonetheless, these are relatively stable assumptions given that the Total Fertility Rate (TFR) was at about 1.85 in 2006. This is a conservative position to adopt and one that reflects the fact that the long-term historical trend is a decrease in the fertility rate, but the shorter term trend is more stable or upward in nature.
The assumptions used for States and Regions vary depending on the base TFR, but they are assumed to follow the general Australia-wide trend. The relatively stable overall TFR masks variations by age of mother. It is assumed that the trend of more births being born to older mothers continues, in particular those born to mothers in their mid to late thirties and forties. Meanwhile, it is assumed the rates of births to those mothers under thirty continue to fall.
There are a number of economic reasons why the Australian fertility rate may decrease further. This includes the recent change in the economic climate with the substantial job losses in many retail and manufacturing industries and the apparent stagnancy in the housing market. In addition, there have been greater moves to curb more of the so-called ‘middle class welfare’ by means-testing programs such as the Baby Bonus, Child Care Rebate, the Private Health Care Rebate and First Home Buyers Grant.
If you need any assistance with understanding the data in profile.id, feel free to contact the population experts at .id (03) 9417-2205 or info@id.com.au. And do follow us on Twitter @dotid or check out our website at id.com.au for more information about population change in Australia.


