One of the questions we get asked most often at .id training sessions is how to get the data, charts and text out of the .id websites and into your working documents and presentations. This blog will step you through it.

Accessibility is one of the key philosophies underpinning the design and delivery of .id’s online information tools. There is certainly no shortage of information out there, but one of the big difficulties is getting access to it in a form that can be analysed, quoted or just presented to your audience in a meaningful way.
The id suite of online information tools addresses these dilemmas by providing a one stop shop of reliable and consistent data that is easily accessible and can be extracted or reported in the format you need.
There are several different and easy ways to accessing the information you need from the .id sites beyond simply viewing them in your web browser. These include;
- Cut and pasted into a document or spreadsheet directly from the screen (table, charts and text)
- Print an entire page
- Export a map
- Export a comprehensive hard copy report
- Download data
So, how do you do it?
1. Cut and pasted into a document or spread sheet directly from the screen (text, tables and charts)
I think this method is one of the most useful features of the id. sites. When I was working as a social researcher in local government I found the ability to simply cut and paste almost anything from the .id information tools straight into my documents an incredibly powerful and time saving feature that very few other webs sites offered.
Text – to copy text simply use your mouse to select the text you want to copy by holding down the left button of your mouse and dragging over the text you would like to include in your document. Then use the right click button on your mouse to bring up the sub menu and select copy.
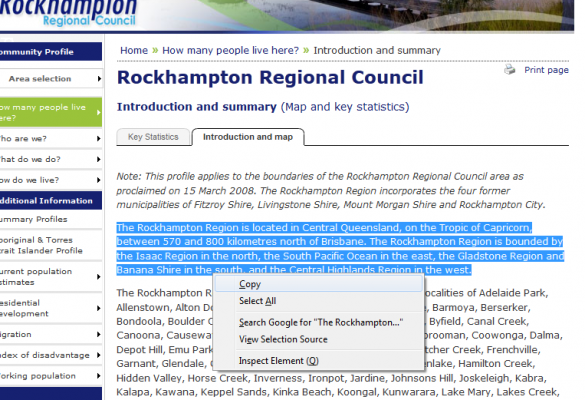
Then open up the document you want to use the text in, move the cursor to the position you want the text and then use the right mouse button again to paste the text into the document. It is as easy as that.

Tables – As with copying text, use the mouse to select the entire table, making sure you include the heading and the source underneath the table.
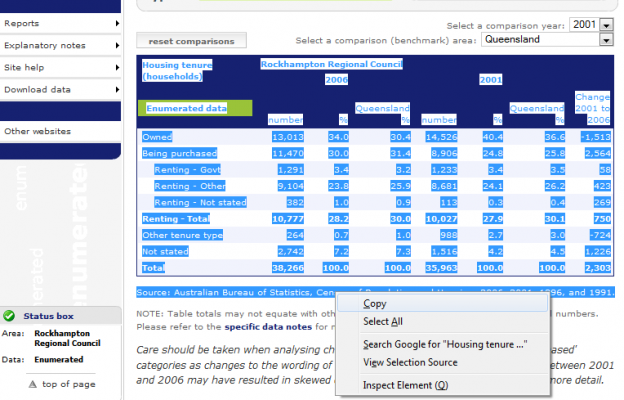
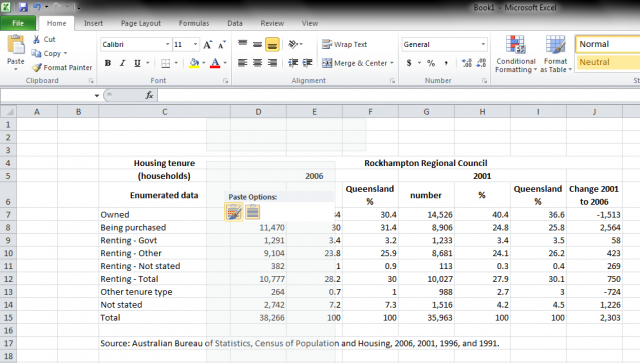
Again open up the document you are working on and use the right mouse button the paste the table into the document. It is important to note that the tables keep their formatting when copied into a document or a spreadsheet. Each figure in the table is place in an individual cell which is particularly useful for doing your own calculations or creating your own charts in Excel.
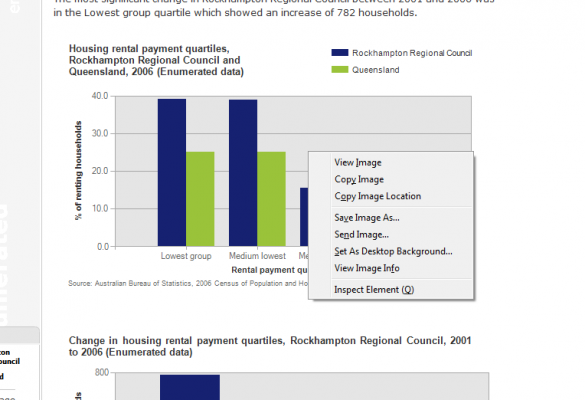
Charts – it is a little different for charts. You don’t have to select the chart, you just need to place the mouse pointer over the chart you want to copy and then use the right mouse button again to copy and paste the chart into your document.
2. Print a page
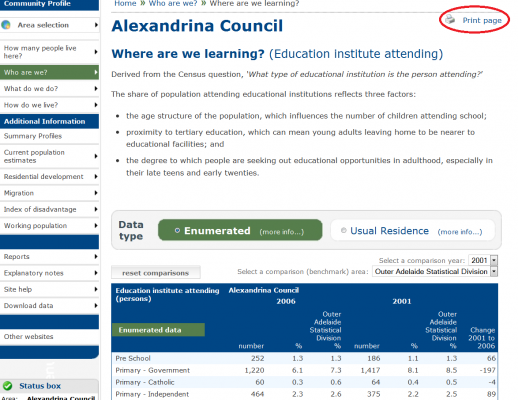
Another great feature in all the .id online information tools is the ability to print any page in a neat and well formatted layout with a single click of the mouse. In the top right hand corner of all the information pages is a ‘ Print page’ icon, simple select this icon and you will get a print preview of the page ready to send straight to your printer.
This is particularly useful if you are rushing to a meeting and you need some quick inform to support an argument or highlight an important issue.
3. Export a map
Visual representations of data are often very powerful and including maps in your reports or presentations really enhances your ability to communicate the stories data can tell about your communities. The .id suite of online information tools makes this easier than ever.
Every map in the .id sites can be exported and then printed or placed into a report or presentation. Whether it is one of the location maps in the ‘Key statistics’ section of a profile.id, or an atlas.id map showing the concentration of people aged over 85 in your LGA, putting these maps in your documents is easy.
Above every map is an Export or Export map option, simple select one of these with your mouse and the current map you are viewing will be exported to your default picture viewer in a jpeg format. Then all you need to do is use the copy and paste feature of your picture viewer to copy the map to your document, it is that easy.
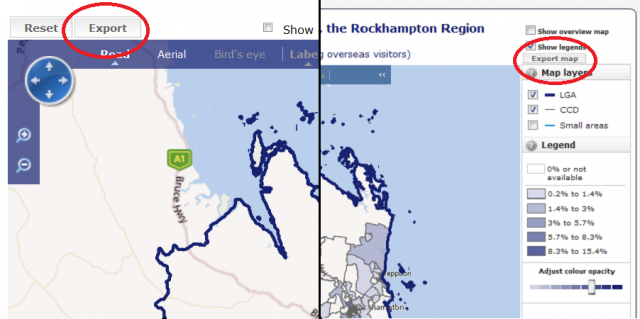
Left: profile.id location map, Right: atlas.id map
4. Export a comprehensive hard copy report
Both profile.id and forecast.id have detailed hard copy reports for the whole LGA and every suburb or small area detailed on each the sites. These reports are very extensive including analysis, tables and charts that cover nearly every
piece if information on the site, so be prepared, some of the reports can be up to 100 pages long. For an example see the Coffs Harbour profile report or Whittlesea forecast report. You can access these reports yourself from any profile.id or forecast.id site.
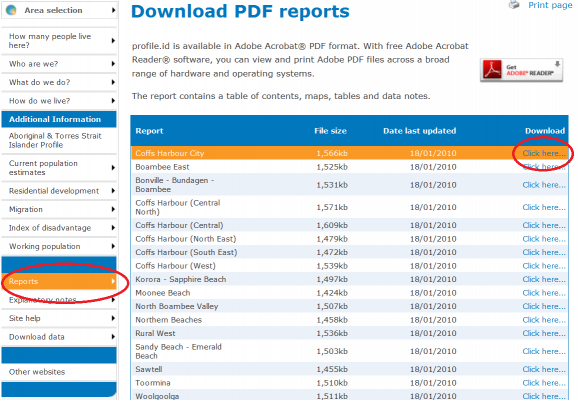
profile.id – Go to the Reports section towards the bottom of the left hand menu and select ‘Download PDF reports’. Then simply select the download link for the area you would like to report on.
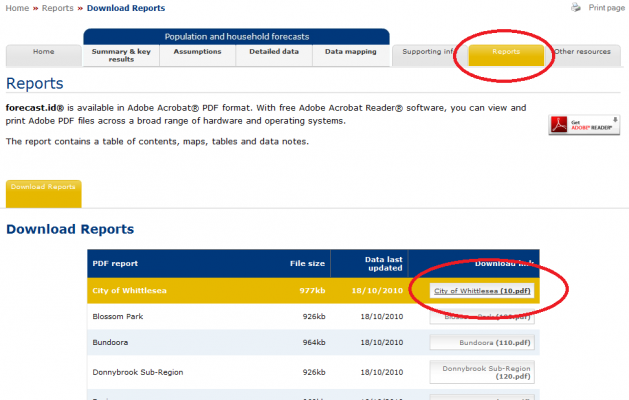
forecast.id – from the report tab in the top left corner of the site. Again, simply select the download link for the area you would like to report on and a PDF report will be downloaded to your computer.
5. Download data
As you can see form this blog the user friendly interface of the .id sites lets you access the information you see on the screen quickly and simply in a variety of formats. However if you are after more detailed data, data download can get you targeted and accurate information, fast. It is especially useful for comparing results between a number of small areas at once, or across several Census years, and also has some additional data which is not displayed in the main interface of profile. If you would like to find how to use data download see Glenn’s blog The power of data download.
You can access .id’s local government (and suburb) websites from our demographic resource centre.
If you would like to receive more updates about demographic or economic trends, do follow us on twitter @dotid or subscribe to our blog (above).


