With the user-friendly interface of profile.id, it’s easy to get most information you are seeking, by navigating around using the menu options and tabs. But if you are seeking specific information, data download can get you targeted and accurate information, fast. It is especially useful for comparing between a number of small areas at once, across several Census years, and also has some additional data which is not displayed in the main interface of profile.id.
Let’s say you are developing a library LOTE collection, specifically Filipino (Tagalog), in large council with a number of suburban libraries. Where should we concentrate the largest collection, to be near the largest group of potential customers?
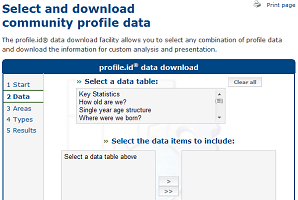
Simply click on “download data” at the bottom of the left hand menu in your community profile. This will take you to a “start” screen. Click on start, then, in the data screen (as shown above) make your selection(s) from the table.
You would click on “what language do we speak at home?” – that will give you a menu to select from in the “data items” box. You would select, Filipino (Tagalog). Note that you’re not limited to the list of the top 10 languages featured in the main part of profile.id, but can select from about 90 different languages (and birthplaces, plus additional religions if you choose those topics).
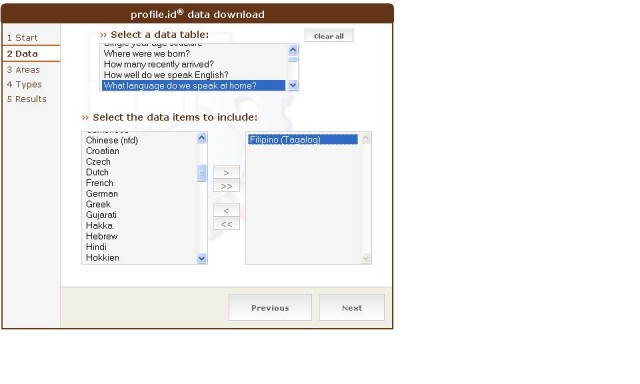
Click the arrow button (>) to put this selection in the right hand box. Then click “next”.
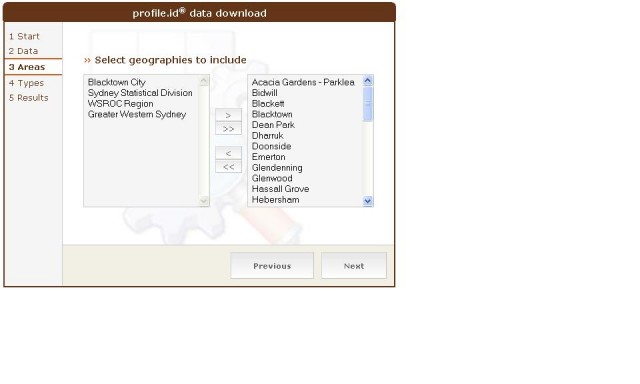
Then, select the small areas you want to include – you can highlight all your small areas by using the shift key, and the down arrow key. Again, use the (>) button to put those small area selections in the right hand box. Click next.
You’re almost done.
Finally, just click what census years you want (often it will be just the latest one) and whether you want to see actual numbers or the result as a percentage of the small area. In many cases, clicking both is a good idea because you will see actual numbers, and also the context of those people as a percentage of the total population of that area.
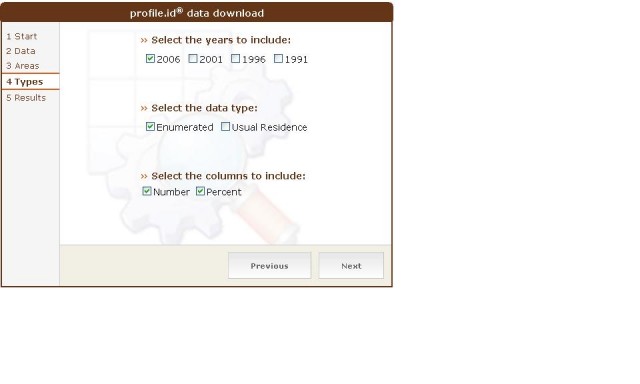
Click next, and you will get a table of exactly how many people, (in absolute numbers and as a percentage of the population) speak Filipino at home, by small area. If you choose multiple Census years you can also look at how this is changing.
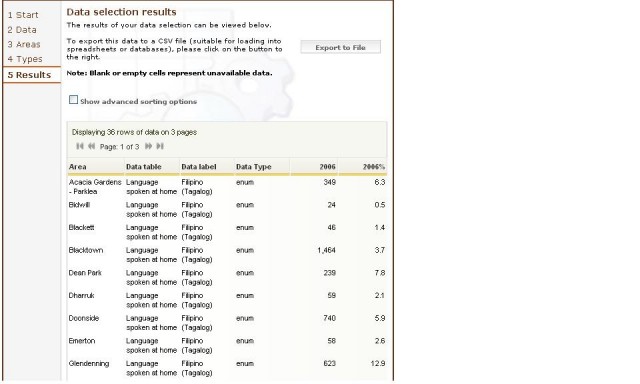
Powerful stuff!
And you can print it, and/or also export the final result into an excel spreadsheet by clicking on “export to file”. From Excel you can make your own charts and calculations.
If you enjoyed this article, sign up to get updates via email or twitter (above).


.png)
.jpg)


