economy.id is a fantastic resource for helping a Local Government Area describe, explore and promote the local economy. We’ve just rolled out a set of changes to make it even better. These changes have resulted from client feedback, and also input from our economic modellers, NIEIR. Here we’ll go through the main changes and how best to make use of them.

.id’s websites are not static. Through our training programme and feedback from clients we get suggestions for new datasets, changes to the layout of the pages, and new ways of presenting existing data. Our economic profiling tool, economy.id, is the latest in our suite of online resources to get the treatment.
Improvements to menus
- Firstly we have a new menu structure, which is based on the principal of asking questions about your local economy. This is the philosophy we’ve always had, making data accessible by focusing on the question it answers for you.
- Many of the menu items now have two lines – one asking a question, the second line telling you the name of the dataset. So if you’re looking for a specific dataset you can go straight to it. But if you’re not sure which data set will answer your question, you can search by question instead.
- And we’ve moved the topics into more logical groupings, to help you find what you’re looking for. For instance, all data relating to where people work, including “Where do our workers come from?” (self-sufficiency), “Where do our residents go to work?” (self-containment), and “Where is employment located?” ( employment location maps) have been moved under the heading “Where do people work?”.
- Check out the City of Knox’s economic profile to see how easy it is to find what you’re looking for.
New topics
- Following feedback from several training sessions, we’ve added a new topic for Worker Productivity under “How productive is our economy?” This shows for each industry, the value-added contributed to the economy by a worker in that industry, and also by each hour worked in the industry. It shows how labour intensive an industry is, and how valuable the workforce is in each industry. For instance, the City of Knox worker productivity page shows that adding a worker in Food Retailing will increase your value-added by $32,000 p.a., but adding a worker in Telecommunications Services adds about $207,000 to your economy. (Hint – to find these detailed industry sectors, click on the + besides the main category).
- Benchmarking also shows whether your workers in a particular industry are more or less productive than the wider region, and the available time series lets you see whether this is increasing or decreasing.

- Another new topic under “How productive is our economy?” is “Household Productivity”, showing the derivation of household disposable income for the area. This is quite interesting as it shows the effect of taxes, business income, property income and cash benefits (welfare payments) on the area. You can of course compare to your benchmarks, and see for instance, whether households in your area are mainly reliant on government payments, salary income, or running their own businesses. Because the data are available back to 1998, you can also see if this is changing over time.
Improvements to economic indicators
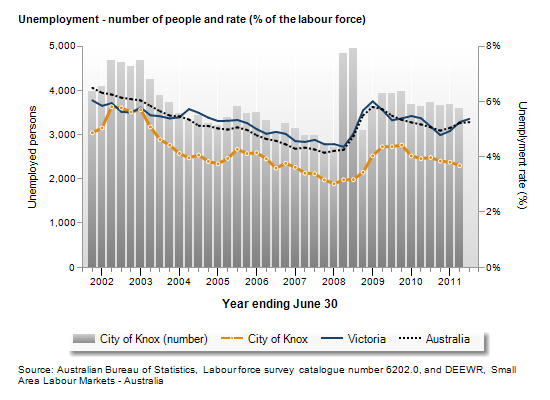
- New detailed indicators pages have been added for the most popular economic indicators, unemployment and building approvals. They now have a full data table with quarterly/annual data (and it can be exported) and two charts, showing raw numbers and comparison to benchmarks over time. Here you can see that Knox is consistently below the Victorian and Australian unemployment rate.

- Building approvals data now show the value of approval in dollar terms with direct comparisons to benchmarks. Value of approval has replaced number of dwellings as the indicator because it is more relevant to the economy, and includes both residential and non-residential construction. For those councils still needing number of dwellings approved, this is still available in profile.id.
- The other indicators pages haven’t gone away. For a quick snapshot you can now go to Highlights and Introduction->Economic Indicators->Summary, and we’ve made some of the charts a bit clearer as well.
Other changes
- Median income from the Census has been added to the worker profiles and labour force sections, giving a quick snapshot of average wages by industry.
- A few new measures have been added to the highlights page. All measures now show what percentage of the State total your area contributes.
- We’ve changed some of the wording and terminology around the microsimulation modelled datasets to make it clearer what they refer to.
And more changes are on their way so stay tuned!
If you have any feedback about the changes, please feel free to contact .id on (03) 9417-2205 or info@id.com.au. If your council does not have economy.id and you’d like a presentation at your offices, please also contact us.


