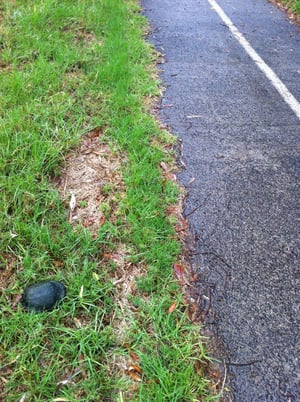
I was riding my bike home from work in the rain last night, when I came across an unexpected lump on the cycle track. To my amazement, it turned out to be a turtle crossing the road. This was not something I expected to see in the middle of a city of just under 4 million people. I picked the little guy up and moved him off the road – and then spent the rest of the ride home worrying that I’d put him on the wrong side of the road and now he’d have to to through the whole slow process again to get to the other side. It also got me to thinking about the statistics of commuting by bike in Melbourne.

Melbourne has a reputation as a bicycle friendly city. The Bicycle Victoria website tells me that Melbourne’s Trail Network (MTN) is committed to a vision of 1200 kilometres of shared trails across the metropolitan area. My route home follows the Main Yarra Trail and then another bike path which enables me to commute 15kms from inner city Collingwood to suburban Doncaster almost without riding on a road.
On the day of the last Census in 2006, 18,887 people across metropolitan Melbourne used a bicycle as their main method of travel to work. This represents 1.1% of the workforce, and an increase from 0.8% in 2001 (12,837 people). How does this compare to other capital cities across Australia?
How does Melbourne compare to other cities?
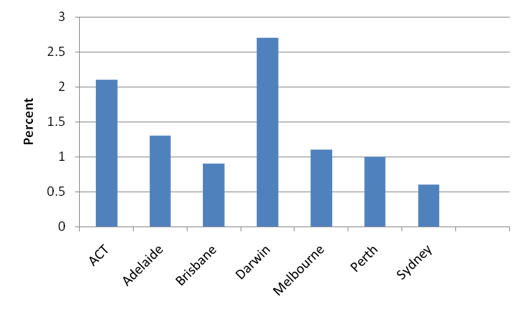
Travel to work by bicycle, Capital City Statistical Divisions, 2006

Source: ABS Census of Population and Dwellings, 2006
Darwin is the clear winner, with 2.7% of the population commuting to work by bicycle on the day of the Census in 2006. What reptile might an unsuspecting cyclist find across a bike path in Darwin?
It’s probably worth noting that the Census was conducted in August, which is winter in Melbourne, but the dry season in Darwin, so the timing is likely to have a considerable influence on the comparative figures. You can access more Darwin population statistics here.
In the ACT, August is a partcularly cold month, but the level of bicycle commuting is still higher – a testimony to the comprehensive network of bike paths in this city.
Sydney’s hilly topography is a big obstactle to bicycle commuting in that city. Free population statistics for most Sydney local government areas are available from .id’s website.
Bicycle commuting statistics within Melbourne
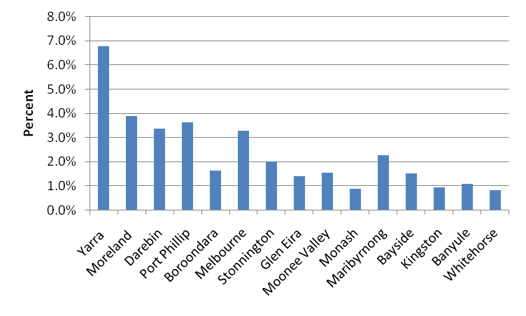
Citywide statistics mask the large variations within cities with inner city suburbs having substantially larger percentages of bicycle commuters.
Travel to work by bicycle, Top 15 Melbourne Local Government Areas, 2006

Source: ABS Census of Population and Dwellings, 2006
Access more detailed commuting statistics for all Melbourne LGAs.
Manningham, my local government area, does not feature in the top 15. A quick look at the data in the Manningham Community Profile shows that only 119 people or 0.2% of the working population commute to work by bicycle. Perhaps that turtle had plenty of time to cross the road between cyclists afterall.

Access free demographic resources
.id provides councils across Australia with online demographic resources including community profiles, social atlases, population forecasts and economic profiles. You can access these resources at no charge, either by visiting your council’s website, or directly from .id’s website. The information is delivered as interactive websites and answers all your questions about the community including age structure, ethnicity, income levels, income, occupations, qualifications, migration patterns etc etc. Enjoy!


