The winners and losers of population growth in Australia for 2016
Around Christmas each year, the ABS (rather sneakily) releases one of the most interesting and important population data sets – the Australian Demographic Statistics which gives us the full financial year population figures. Between 2015-2016, the national population growth continued to pick up with one state powering ahead in the growth stakes: Victoria.
It’s worth noting that these numbers do NOT yet incorporate any information from the 2016 Census – that data will be released progressively by the ABS this later year.
Population growth and building approvals in Australia between 1997 to 2016
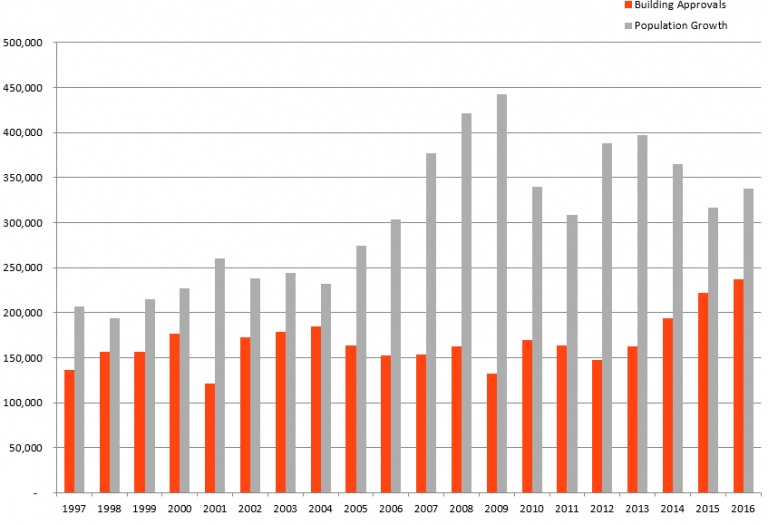
Australia’s population grew by 337,800 people in 2015-16, to sit near 24,127,200. The chart also shows an increase in the building of new dwellings for the 5th year running, hitting 240,000 new dwelling units for the year. This is the reason you may see talk about an “apartment glut” in some areas but if you look back a few years, you will see that it may just be making up for low rates of building in earlier years of high growth.
Breakdown of population and growth by state and territory
Population growth by state in 2015-2016
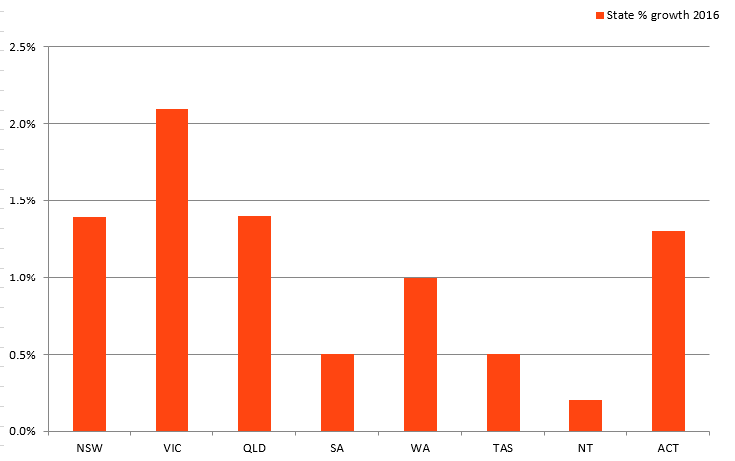
And the winner is… Victoria
The amazing thing about this is the growth rate of Victoria. It is the only state or territory that exceeded the national growth rate of 1.42% in 2015-16 – all others were below this rate. And Victoria exceeded the national growth rate by a large margin, with a growth rate of 2.07%.
The last time Victoria had population growth this high in percentage terms was in 1964, and the state has NEVER added this many people in one year before.
The main drivers of this change in Victoria are a high level of overseas migration (65,000 for the year, just over half total growth), and the largest net interstate migration of any state, a massive turnaround from a decade ago when Victoria was losing people interstate. In 2015-16, 16,699 more people moved to Victoria than from Victoria, adding to the population boom. The rest of the growth, about 41,000 people, is due to natural increase (births minus deaths).
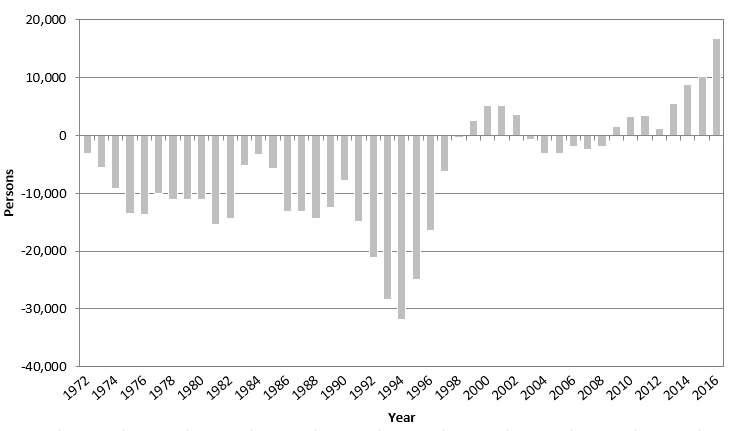
The below chart shows the incredible interstate migration story for Victoria over the past 40 years.
Net interstate migration to Victoria, 1972 to 2016
Population growth in the rest of Australia
Among the other states, New South Wales continues to grow strongly, close to the national average growth rate at 1.4%, adding over 100,000 people again. Western Australia’s growth continues to fall after the mining boom but still added 27,000 people for the year. Queensland, while no longer booming, continues to add 64,000 people per year. Growth has almost stopped in the Northern Territory, with only 500 extra people for the year. In Tasmania which has never been a boom state, population growth has picked up a little, adding 2,400 people with a growth rate of 0.5% to now be nudging 520,000 in state population.
Updated Census information
These population figures will all be updated and adjusted based on the 2016 Census results, which are due to start being released in April 2017. Here are some preliminary dates for the release of Census data from the ABS:
- From 11 April – First release; This will include national, state and capital city data for selected key person, family and dwelling characteristics, such as age, sex, religion, language and income
- From 14 June – Second and main release; It includes the bulk of the community-level data for a wide range of topics, including information on small population groups and for small geographic areas such as Suburbs and Local Government Areas
- From 17 October – Census variables such as employment and occupation data, and migration numbers will be released.
Once the data is released by the ABS, .id will start progressively updating the .id community of local government websites with the new Census data. This is a big job to process the data and get it ready to use on the sites, so to get the information to you faster, we plan to incrementally release updates to our sites with the most popular topics from the main release starting from the end of June 2017. We’ll update you with the latest information as to the timing of our updates as soon as we can, so stay tuned to our blog!
.id is a team of demographers, population forecasters, spatial planners, urban economists, and data experts who use a unique combination of online tools and consulting to help governments and organisations understand their local areas. Access our free demographic resources here.
Glenn Capuano - Census Expert
Glenn is our resident Census expert. After ten years working at the ABS, Glenn's deep knowledge of the Census has been a crucial input in the development of our community profiles. These tools help everyday people uncover the rich and important stories about our communities that are often hidden deep in the Census data. Glenn is also our most prolific blogger - if you're reading this, you've just finished reading one of his blogs. Take a quick look at the front page of our blog and you'll no doubt find more of Glenn's latest work. As a client manager, Glenn travels the country giving sought-after briefings to councils and communities (these are also great opportunities for Glenn to tend to his rankings in Geolocation games such as Munzee and Geocaching).


