Is it all doom and gloom after the boom in Western Australia?
With the end of the mining resources boom in Western Australia, many people are left wondering, Is it all doom and gloom after the boom? We’re so glad you asked! Let’s take a look at what is happening in the West, including the demographic trends affecting the state’s population and the future outlook for WA’s population in the next 20 years.
I’ll use .id’s recently updated small area population forecasts for Western Australia as a basis for this blog to give you the most up to date future view possible. Our Small Area Forecast information (SAFi) for WA covers nearly 3,000 geographic areas across the state, which provides the ability to drill down into granular, hyperlocal detail or build up into customised catchment areas.
How is Western Australia’s population changing?
Some highlights include:
- In the last decade, WA’s population increased by over 511,000, boosting the state’s total population to over 2.6 million.
- During the height of the mining boom, the state’s population growth rate peaked at 3.6% p.a., well above that of Australia.
- More recently, WA’s population growth has slowed from its previous heights.
Population growth rate, Western Australia and Australia, 1972-2016
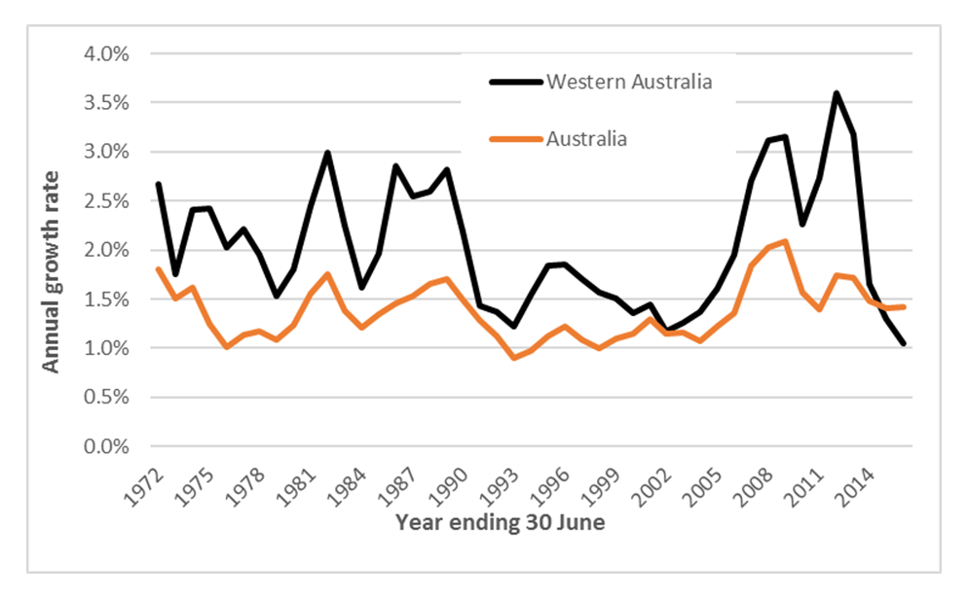
Sources: ABS, Australian Historical Population Statistics, 2014 (Cat. 3105.0), ABS, Australian Demographic Statistics, 2016 (Cat. 3101.0)
The strong population growth WA experienced in the last decade has dropped substantially in more recent years. WA’s population grew at an average annual rate of over 2.5% p.a. in the period from 2006 to 2016, peaking at 3.6% in 2012. In the last two years WA has recorded a lower annual growth rate than the national average (1.3% in 2015 and 1.1% in 2016). In the longer term, however .id expect a recovery to an average annual population growth rate of 1.8% by 2020.
How will the population of Western Australia change in the future?
WA’s population is set to increase by more than a million people over the next 20 years.
The population of Greater Perth is projected to increase from 2.10 million in 2017 to 2.96 million in 2037. This increase represents 86 per cent of the total population increase for Western Australia.
Population change, Western Australia, selected SA2s – suburb equivalent, 2017-2027
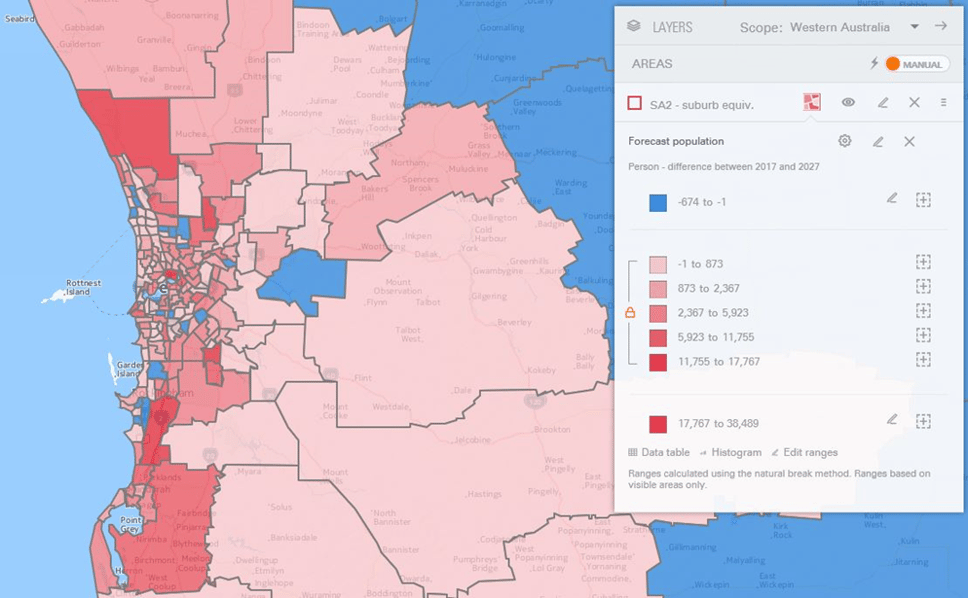
Source: .id, SAFi 2016, shown in .id Placemaker
Forecast population growth in Perth is typically on the fringe of the city, with notable exceptions in Victoria Park and City of Perth where there is vigorous apartment development. City of Wanneroo is an area forecast to undergo a lot of change, with an expected average of 3,150 additional dwellings each year. Residential development within Wanneroo will be concentrated in Tamala Park, Alkimos, and Eglinton and around Wanneroo township as shown below.
Forecast dwelling change, small areas surrounding Wanneroo, 2017-2037
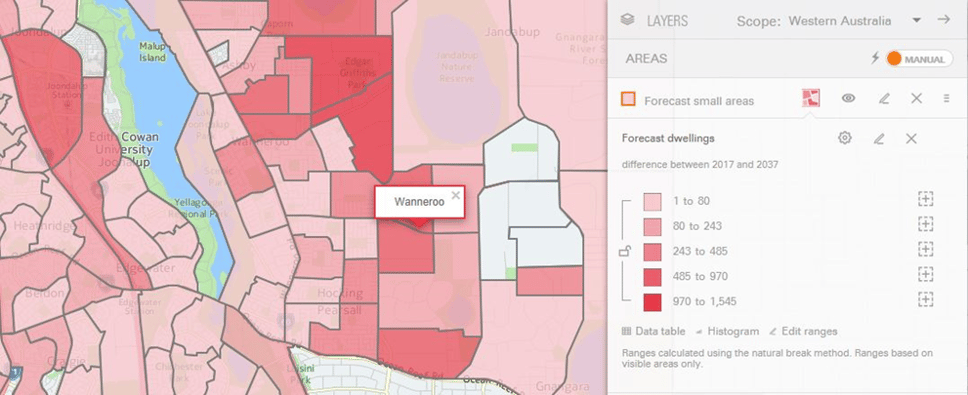
Source: .id SAFi, Western Australia, 2016
Murray Shire is expected to become the fastest growing local government area in Perth, averaging 6.3% p.a. between 2017-37, growing the population by 42,400 to reach 60,200 in 2037. This is due in part to its relatively small population in 2017.
Change in number of dwellings, Western Australia, selected SA2s -suburb equivalent, 2017-2027
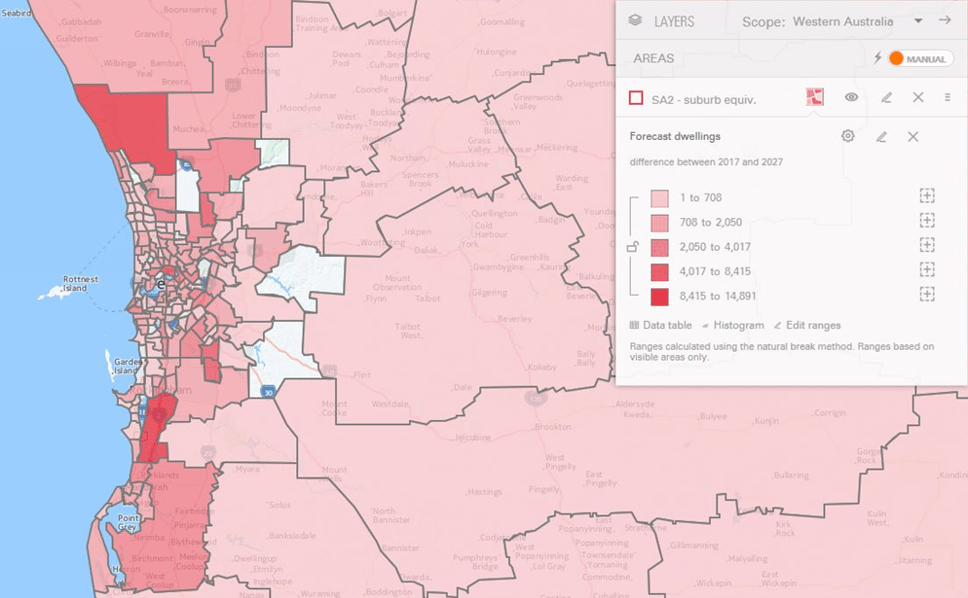
Source: .id SAFi, Western Australia, 2016
In regional Western Australia, mining areas such as the Pilbara-Kimberley are expected to recover from the current downturn with renewed investment and development. There will be a number of local government areas in the Wheat Belt and Outback which are likely to have smaller populations in the future.
Population change, Local Government Areas in Western Australia, 2017-2037
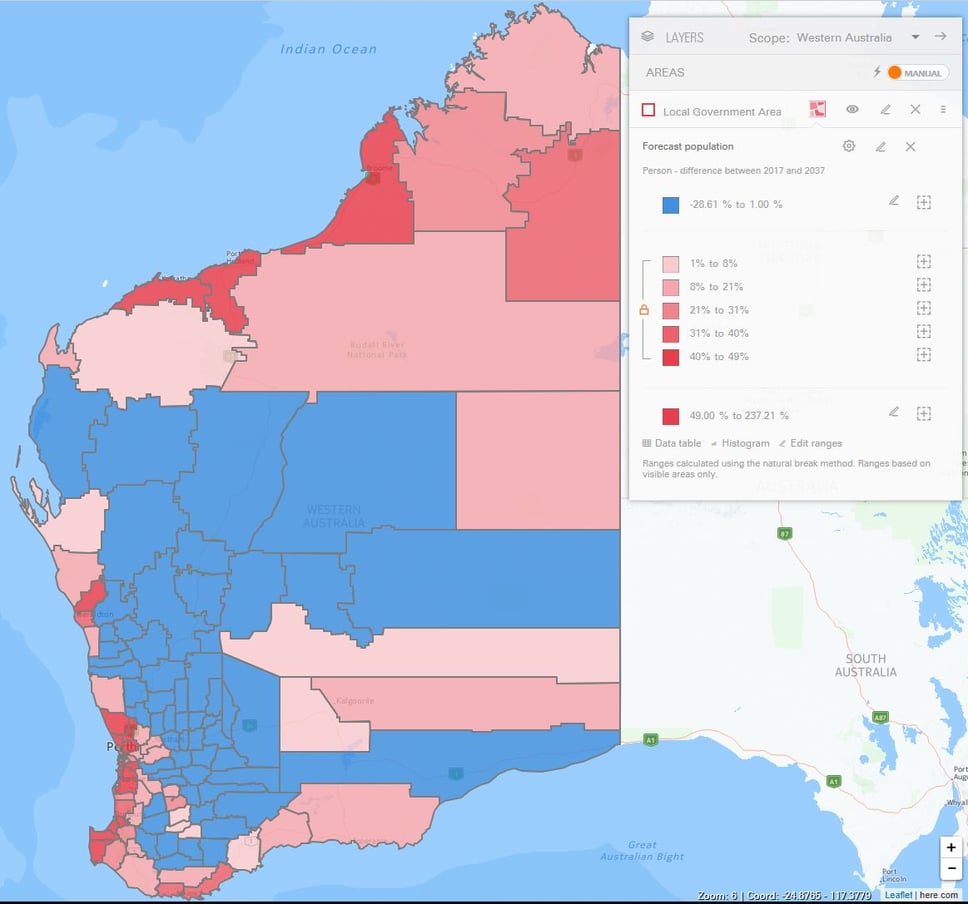
Source: .id SAFi, Western Australia, 2016
Read more in our new eBook, Western Australia: Is it all doom and gloom after the boom?
More about SAFi
.id SAFi provides insight into the future population, from the macro right down to the micro level. The strength of SAFi is its geographic flexibility, being created at a hyperlocal level provides the ability to build user-defined catchments and areas that do not conform to common boundaries.
In addition to WA, SAFi is available for Victoria, New South Wales and the ACT, covering just under 70% Australia’s population. Over time, we intend to extend this coverage, whilst keeping the existing state’s forecasts regularly updated. SAFi provides planners with up-to-date information, with forecasts updated approximately every two years.
Businesses, organisations and governments use this information to inform strategic decisions regarding service delivery and infrastructure provision.
.id is a team of population experts, who use a unique combination of online tools and consulting to help organisations decide where and when to locate their facilities and services, to meet the needs of changing populations. Access our free demographic resources here.
Esther - Team Forecast
Esther joined .id after working in the demography teams at both Statistics New Zealand and the Australian Bureau of Statistics producing national and regional statistics. Esther produces the top-down model for .id’s SAFi (Small Area Forecast information). This involves synthesising overseas, interstate and regional migration patterns to quantify regional change. Esther loves the way statistics assist in understanding our communities and can dispell urban myths or stereotypes.