5 headline stories from the latest economic data
As we wait for demographic information from the 2016 Australian Census, we thought we’d take the opportunity to update you on some of the latest spatial economic trends across Australia now that our economic profiles include National Economics (NIEIR) data for all Local Government Areas from 2015/16.
One of the great things about economy.id is that it provides a fantastic data source for regular, local economic information, which takes account of local changes in the economy, in the years in-between Censuses.
Economic transition in Australia
The latest data from NIEIR show that the Australian economy is continuing its transition from the mining construction boom towards the service sector economy. This has been great news for the dominant service sector states Victoria and New South Wales.
The problem with this economic transition is that it is having a major spatial impact on the distribution of employment growth within Australia. This challenge highlights that often trends at the State level can mask what is happening at the local level. The table below highlights this challenge.
Employment change by area of State
Source: National Economics, 2017
Five stories to tell
- Capital cities – Australia’s capital cities, particularly Melbourne and Sydney, have performed exceptionally well over both periods.
- Inner city growth – employment growth was concentrated in the inner areas of capital cities. For example, the Sydney LGA grew by almost 20% in the last five years.
- Middle ring growth – it is not all about the CBDs. We also find strong growth in many middle ring LGAs. Examples include Blacktown (NSW), Parramatta (NSW), Greater Dandenong (VIC) and Maroondah (VIC).
- The Growth Area story – this story, which is little remarked on but very important, is that the Growth Areas have very strong employment growth. Many of these are in the top employment growth locations in the last year. Hume and Wyndham for example, are in the top 10 largest employment growth LGAs in Australia in 2015-16. Typically the challenge for the growth areas, however, is that job growth is focussed on construction and population led sectors.
- Regional Australia – lastly, and more striking, is the clear shift to slower employment growth in regional Australia. For example, Regional NSW employment growth crawled along over the past five years, growing by only 0.4% per year, well below its rate achieved between 2006 and 2011. The data from NIEIR shows that only 44% of regional NSW LGAs experienced employment growth over the past 5 years. However, there are exceptions to this, highlighting the importance at looking at the LGA level.
See the latest 2015/16 NIEIR economic data in .id’s economic profiles.
Employment growth
Top 20: Largest employment growth by LGA, 2015-16
Source: National Economics, 2017
Regional employment
It is not all bad news for regional Australia. Many major regional cities have grown strongly in recent times. The table below shows the largest growing regional LGAs in Australia between 2015 and 2016. Wollongong is a great example of a regional city on the move, benefiting from its economic transition to knowledge and services and evolving into an important ‘Knowledge Outpost’ to the Sydney economy. Importantly, its neighbour – Shellharbour is also benefiting from the Wollongong growth story and also makes the top 20 list for 2015-16. Not bad for a region that used to be largely reliant on steel.
Table: Top 20 – Largest employment growth by Regional LGA, 2015-16
Source: National Economics, 2017
Seeing the story spatially
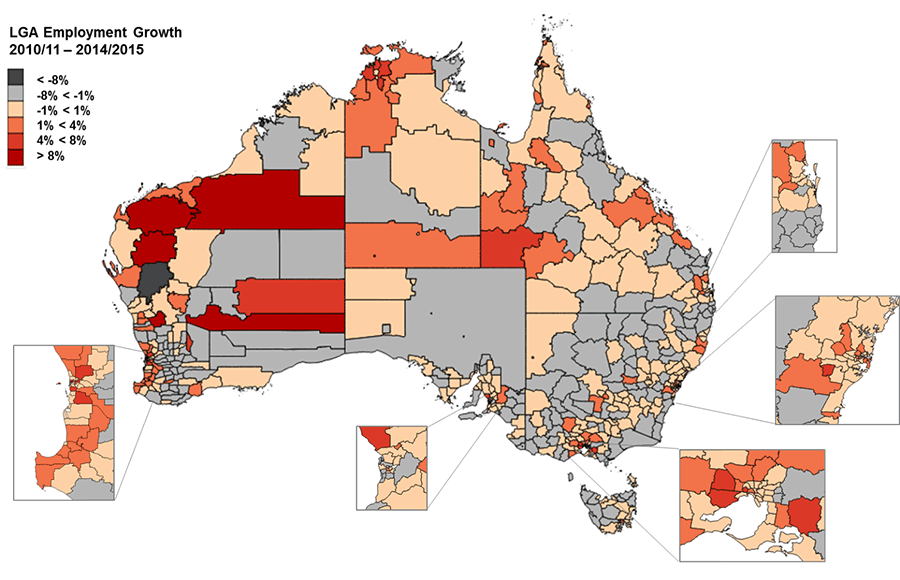
Mapping employment growth across Australia really illustrates some of the transitional changes occurring in our economy. In the four years from 2011 to 2015, average annual growth in the resources states (WA and Qld), even in regional areas, was still relatively strong.
LGA Average Annual Employment Growth – 2011 to 2015
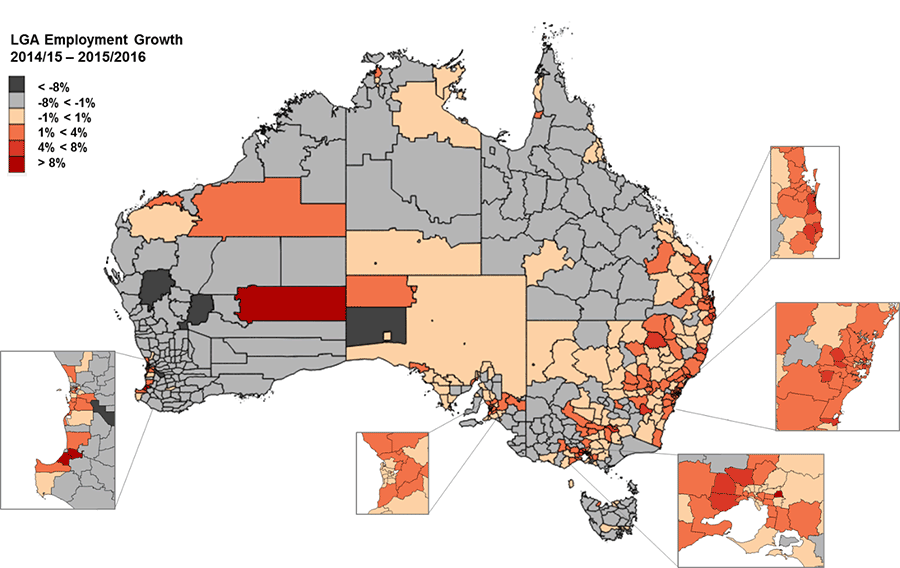
However, we can see from the second map below that between 2015 and 2016 the east coast has been the main area driving national employment numbers. This second map also highlights the strong employment performances in growth areas around out major cities during this period.
LGA Employment Growth – 2015 to 2016
What stories can you tell with the latest economic data for your local area in economy.id?
.id is a team of demographers, urban economists, spatial planners and data experts who use a unique combination of online tools and consulting to help local governments and organisations understand their local area economies. Access our free economic resources to help profile your local economy.
Rob Hall
Rob is driven by a desire to help shape communities for a better future. Trained as an economist, he has a unique twenty-year background in economics, demographics, statistics and strategic planning with a focus on understanding how economic forces influences local government areas across Australia. At .id, Rob provides Local Government with high-quality analysis and information tools, including specialised consulting services and tailored information products such as economy.id.