Has the baby boom ended? A downward trend in Tasmania
Each November the ABS releases births data for Australia, States and smaller geographic areas such as LGAs. This data not only provides us with a glimpse into the future, but it also reflects contemporary social trends around families in particular. What does the latest data tell us?
Australia’s baby boom
Firstly, the number of births in Australia appears to have peaked. In 2015, there were 305,377 births registered, representing a fertility rate of 1.81. Although this was an increase from the number of births recorded in 2014, the fertility rate remained largely unchanged (because of the increase in population). Australia’s peak year for births remains 2012, when there were 309,582 births registered. Aside from 2014 – when the data was influenced by a delay in birth registrations in NSW – the number of births in Australia has been over 300,000 per annum since 2008.
The number of births is a function of the propensity to have children (reflected in the fertility rate) but also the number of women who are in the childbearing age groups (generally 15-49 years). It’s well documented that Australia has had a low fertility rate for many decades – in fact, it’s been below replacement level since 1976. The fertility rate of 1.81 in 2015 is lower than the peak of 2.02 recorded in 2008, but still just above the rates recorded in the early 2000s. Though the fertility rate may decline, it’s possible to have an increase in the number of births if the pool of 15-49 years increases – and certainly high levels of overseas migration contribute to this as migrants are more likely to be young adults.
2015 data shows that the Northern Territory has the highest fertility rate (2.12) and Victoria the lowest (1.73). Across most of Australia, fertility rates are lower in the state capital cities compared to regional areas. Greater Darwin is the notable exception with a fertility rate of 2.11 compared to 2.09 for the rest of the Northern Territory. Greater Melbourne has the lowest fertility rate of the capital cities, at 1.65.
The end of Tasmania’s baby bump
Tasmania recorded 5,680 births in 2015, continuing the general decline recorded since 2008, when there were 6,775 births registered. This is the lowest number of births registered since 2000, when the figure was 5,692. The decline since 2008 is a departure from the increases recorded over the period 2004-08. Tasmania’s 21st-century ‘baby boom’ appears to be over, particularly if the downward trend holds in the coming years. Births numbers for Tasmania since 1965 (50 years of data) are shown in the graph below.
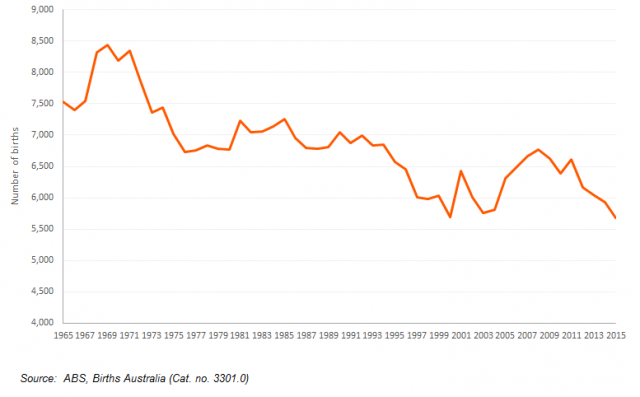
Clearly, Tasmania’s birth numbers are at 50-year lows. Of course, the 1960s was a time of peak fertility in Australia and Tasmania was no exception. Birth numbers were extremely high in the late 1960s when over 8,000 births per annum were registered. Like the rest of Australia, fertility rates started to decline in the early 1970s and birth numbers followed suit. Despite small increases during the 1980s, in the late 1990s birth numbers started to decline rapidly again. In 1998, the number of births fell to a low of 5,978, the likes of which hadn’t been recorded since the 1940s i.e. before the post-war baby boom.
So why have births declined?
Tasmania is a great example of how birth numbers are influenced by the size of the pool of women aged 15-49 years. We’ve blogged previously about how Tasmania’s age structure is reminiscent of regional Australia – it is older, and there is significant outwards migration of younger adults to the rest of Australia. When young women leave Tasmania and don’t return, any babies they have will be born elsewhere – it’s as simple as that. Typically, Tasmania loses younger people (including children) to other states but gains older people i.e. 45 years and older. The ABS estimated that Tasmania lost almost 1,390 persons aged 15-44 years in 2014-15. Migration losses in this age group have been recorded since the ABS began the RIME series in 2006-07, and this is having an impact on the size of the cohort who are having children. Further down the track, and in the absence of substantial net migration gains in the number of children, the smaller size of this cohort will make itself felt as they move through the age structure and into the education system.
The downward trend in birth numbers in Tasmania is not unique in the Australian context, it’s more the scale of the decline and the impact this is having on the demographic future of the State and the challenges this presents for service planning. Ironically, children born between 2008 and 2011, when the number of births was relatively high, are now impacting on school enrolments and the demand for education services. In the absence of substantial net migration gains in the number of children, children born in 2014 and 2015 will have the opposite effect as the demand on schools subsides. This is a simple but effective way of demonstrating how dramatic shifts in birth numbers have significant impacts well into the future. I’ve never been a fan of the term ‘baby bounce’ but it would appear from the Tasmanian numbers that this is well and truly over.
.id is a team of demographic and spatial analysts who use a unique combination of online tools and consulting to help organisations strategically plan to meet the needs of changing populations. You can access .id’s free online resources to find different demographic trends in over 250 local government areas and their suburbs across Australia and New Zealand.
Simone - Myth Buster
Simone has a rich background in human geography, demography and urban planning – a background that was useful in her previous roles in the Commonwealth and State Governments, and now as part of the forecast team at .id. From the Queensland coast to the southern suburbs of Perth, Simone produces population and dwelling forecasts that help local governments make informed decisions about future service and planning needs. She is a regular contributor to .id’s blog and has spoken at several conferences on how our cities and regions are changing. She is a big advocate of evidence-based planning and how Census and other data can inform this. Outside of work Simone is a keen traveller and photographer – interests that tie in well with her professional life and help her to understand “place”.