Where are the kids? Top 5 growing and slowing suburbs for school aged children
By 2026 there will be 705,000 more kids in our schools than there are today. That’s a lot of new schools… 1,400 to be precise!
School planners need to decide where to locate these new schools to meet the growing demand of school aged children, but planning for large scale growth is not always that straightforward.
Some schools may be caught by a surprise wave of school enrollments and require short term capacity in the form of relocatable classrooms, while others may see declines in school age children during wider periods of rapid or sustained population growth and require scaling back of class numbers. Understanding how broad population trends manifest locally is key to planning for the future.
So which suburbs will experience the largest growth, and where will school aged children decline?
.id’s Small Area Forecast information (id. SAFi) allows planners to zoom in and pinpoint suburbs where growth in school aged children will occur over the next ten years. So far, these forecasts have been developed to cover New South Wales, Victoria, Western Australia and the ACT.
Here’s the top 5 and bottom 5 suburbs in terms of absolute change in 5 to 17 year olds from 2016 to 2026.
Top 5 growth suburbs for school aged children
| Rank | Suburb | 2016 | 2026 | Change |
| 1 | Cobbitty – Leppington (NSW) | 3,206 | 12,588 | 9,383 |
| 2 | Riverstone – Marsden Park (NSW) | 3,479 | 12,397 | 8,918 |
| 3 | Cranbourne East (VIC) | 4,795 | 12,929 | 8,134 |
| 4 | Yanchep (WA) | 4,254 | 11,186 | 6,931 |
| 5 | Epping (VIC) | 6,928 | 13,853 | 6,925 |
The top 5 reveals significant growth and pressure in outer growth areas in the next ten years. Interestingly when you run this same analysis based on percentage growth, it shows more inner city areas such as Melbourne’s Docklands, but that’s a blog story for another day…
Top 5 declining suburbs for school aged children
| Rank | Suburb | 2016 | 2026 | Change |
| 1 | Glenmore Park – Regentville (NSW) | 4,449 | 4,129 | -321 |
| 2 | Halls Head – Erskine (WA) | 3,124 | 2,831 | -294 |
| 3 | Thornlie (WA) | 4,247 | 3,964 | -282 |
| 4 | Green Valley – Cecil Hills (NSW) | 6,577 | 6,312 | -265 |
| 5 | Blaxland – Warrimoo – Lapstone (NSW) | 3,251 | 3,010 | -242 |
Suburbs forecast to experience declines in school aged children in the next ten years tend to be more outer suburban and regional areas.
Deciphering the trends
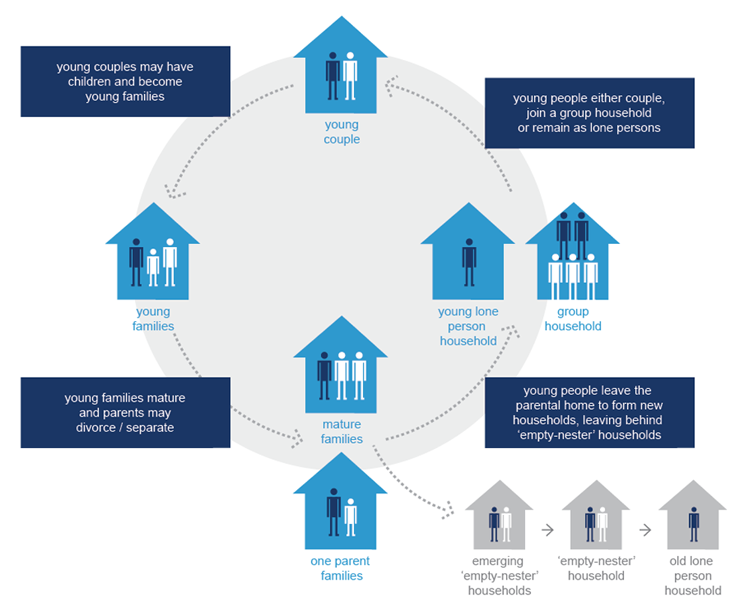
So how can we better understand these areas of growth and decline in population? Changes in population aren’t generally sporadic or unpredictable – they follow certain patterns that can best be explained by what we call the suburb lifecycle. This concept demonstrates that population change follows a cycle rather than a linear trend.
Typically, new areas are settled by young households comprising young couples and young families (with school-aged children or under), with some mature families. As these families grow, the average size of the household increases.
Following this initial rapid development, these households most often ‘age in place’: growing in size while staying in the area. This slowly shifts the demand for services, facilities and dwelling types as households mature.
As the children grow up and move out of home the suburb is left with more ’empty nester’ (two person) households, often living in large family dwellings. If a suburb can’t attract young families back into the area, it becomes increasingly populated by older couples or lone persons, and its population begins to decline with mortality. As an area ages, housing stock is freed up through migration and mortality, enabling families to begin re-populating the area and continue the cycle.
Suburb lifecycle
Planning for the future
Understanding the lifecycle suburbs follow is important in helping governments and organisations predict changing demand for services, facilities and dwelling types. Areas that manage to minimise the loss of family-oriented and maintain diverse housing stock that can accommodate a variety of households are more likely to see the process of regeneration occur.
Granular population forecasts can be used to visualise the way these big picture population trends play out locally, providing school planners with an evidence base to help answer strategic questions about where and when to locate schools in the future.
.id work with a variety of education providers from the Catholic Schools Office, Department of Education through to individual independent schools, helping them make large scale investment decisions to ensure schools are located in the right place, at the right time.
For more detailed information, read our eBook: Planning education provision in a changing Australia.
.id is attending the EducatePlus conference on the Gold Coast from 7- 9 September 2016. We are keen to talk to school planners about the way demographic trends are impacting local areas.
Sally Blandy
Sally comes to .id after 8 years as a management consultant at KPMG. She specialises in providing strategic advice based on demographic evidence across a range of industries including utilities, property, education and the resources sector. Sally works with our Placemaker and SAFi clients to understand how consumer and demographic trends can impact the demand for their products and services. Sally enjoys cooking, spending time down on the Mornington Peninsula, catching up with family and friends and hanging out with her sausage dog Frankie.