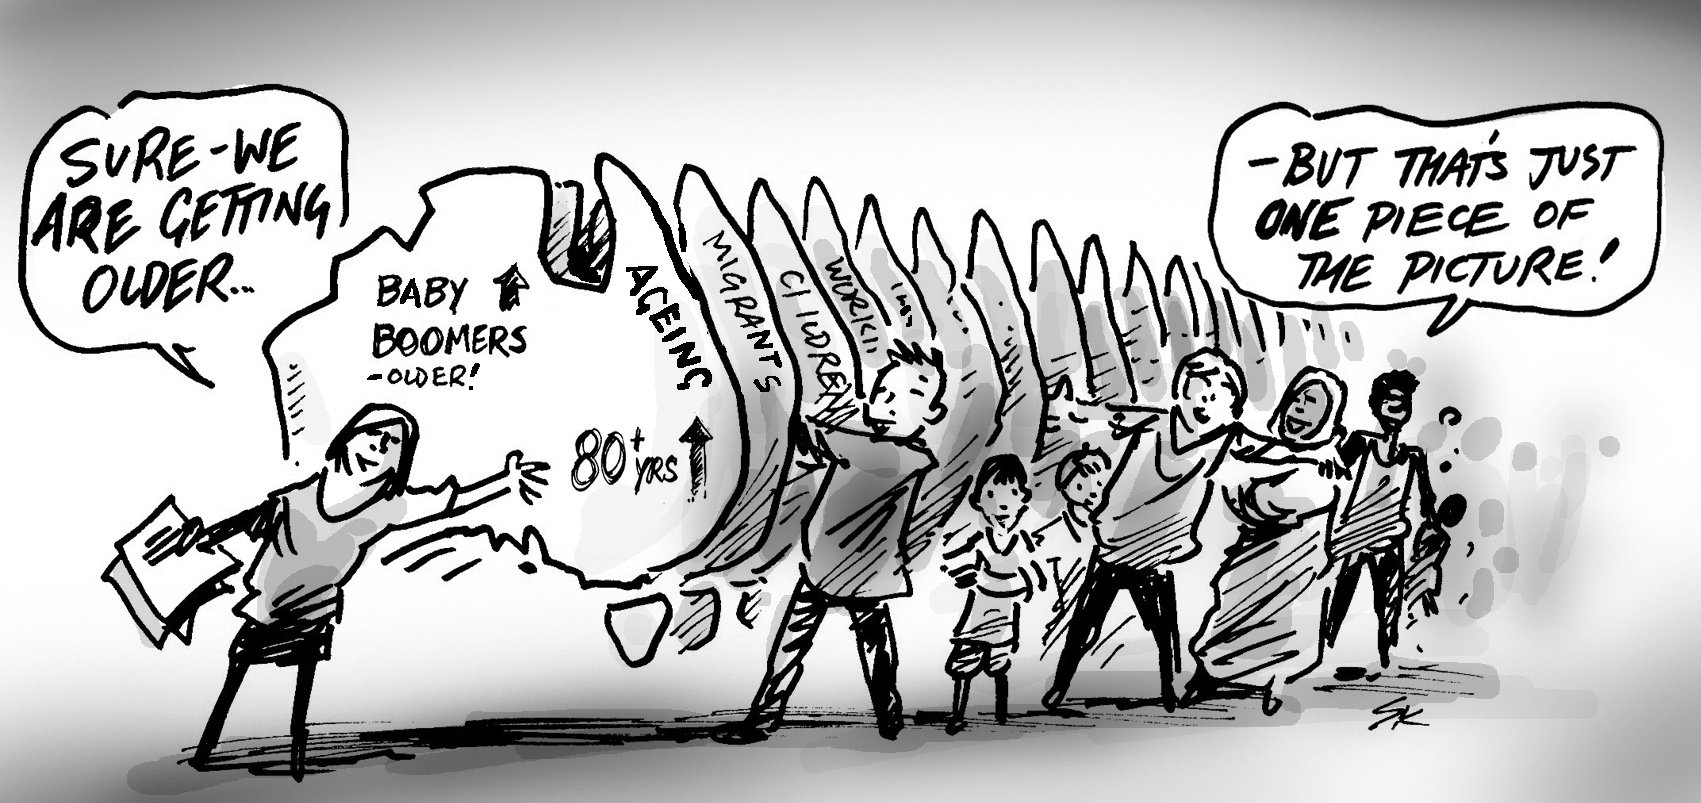
By 2036, there will be an additional 2.3 million Australians aged over 70. Are we adequately prepared for Australia’s ageing population?
Planning and delivering aged care services and retirement living facilities is a complicated business, requiring an in-depth understanding of local demographics to know where and when services are required for our elderly population.
From experience working with aged care providers, we understand that a 5-10 km radius from the facility is often used as a rule of thumb to determine where potential customers live. The distance a client will travel also depends on whether the facility is in an urban or rural environment. Other inputs worthy of consideration include the location, size and quality of competing facilities, road networks and physical infrastructure, and psychological or topographical barriers such as not wanting to cross rivers or major roads. In addition, the ability to find sites of suitable size in these areas often proves a challenge.
To make matters even more complex, while some people move into care close to where they live, others prefer to move into facilities that are closer to where their children or family live. In understanding a catchment area for aged care facilities and services, it is useful to understand where both the target market and their children live.
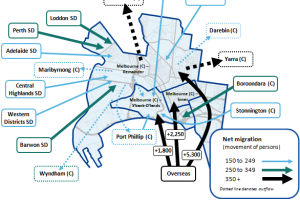
So where is the largest growth and decline in people aged over 70?
Understanding how broad population trends manifest locally is key to planning future services. Using Small Area Forecast information (.id SAFi) allows planners to zoom in and pinpoint suburbs where growth in persons aged over 70 will occur over the next two decades. These small area population forecasts have so far been developed to cover New South Wales, Victoria, Western Australia and the ACT.
Here are the top 5 growing and slowing area for people over the age of 70 between 2016 and 2026:
Top 5 growth suburbs for people over the age of 70
Top 5 growth suburbs for people over the age of 85
Interestingly, many of the suburbs showing growth in the 70+ population are in the growth corridors of Sydney and Perth – areas which tend to attract young families and aren’t typically associated with a growth in older residents. These areas are expecting significant overall growth, which although dominated by family age groups, also includes large numbers of older residents. Growth areas typically provide sites of sufficient size to accommodate retirement and aged care living.
From a critical mass perspective, it is interesting to note that in 2016 the top two areas with the highest absolute number of people over the age of 70 were Tweed Heads South with 6,299 and Rosebud–McCrae with 5,678. By 2026, they continued their high rankings in second and third place with 7,952 and 7,296 people respectively.
Top 5 suburbs with declining/the least growth for people over the age of 70*
*Only areas with more than 50 people over 70 in 2016 are included in this table
Top 5 declining suburbs for people over the age of 85
As you can see from the tables above, only a few areas are experiencing a decline in the number of people aged over 70. This shows how places are getting older in general as people live longer and as the baby boomer generation moves into this age group.
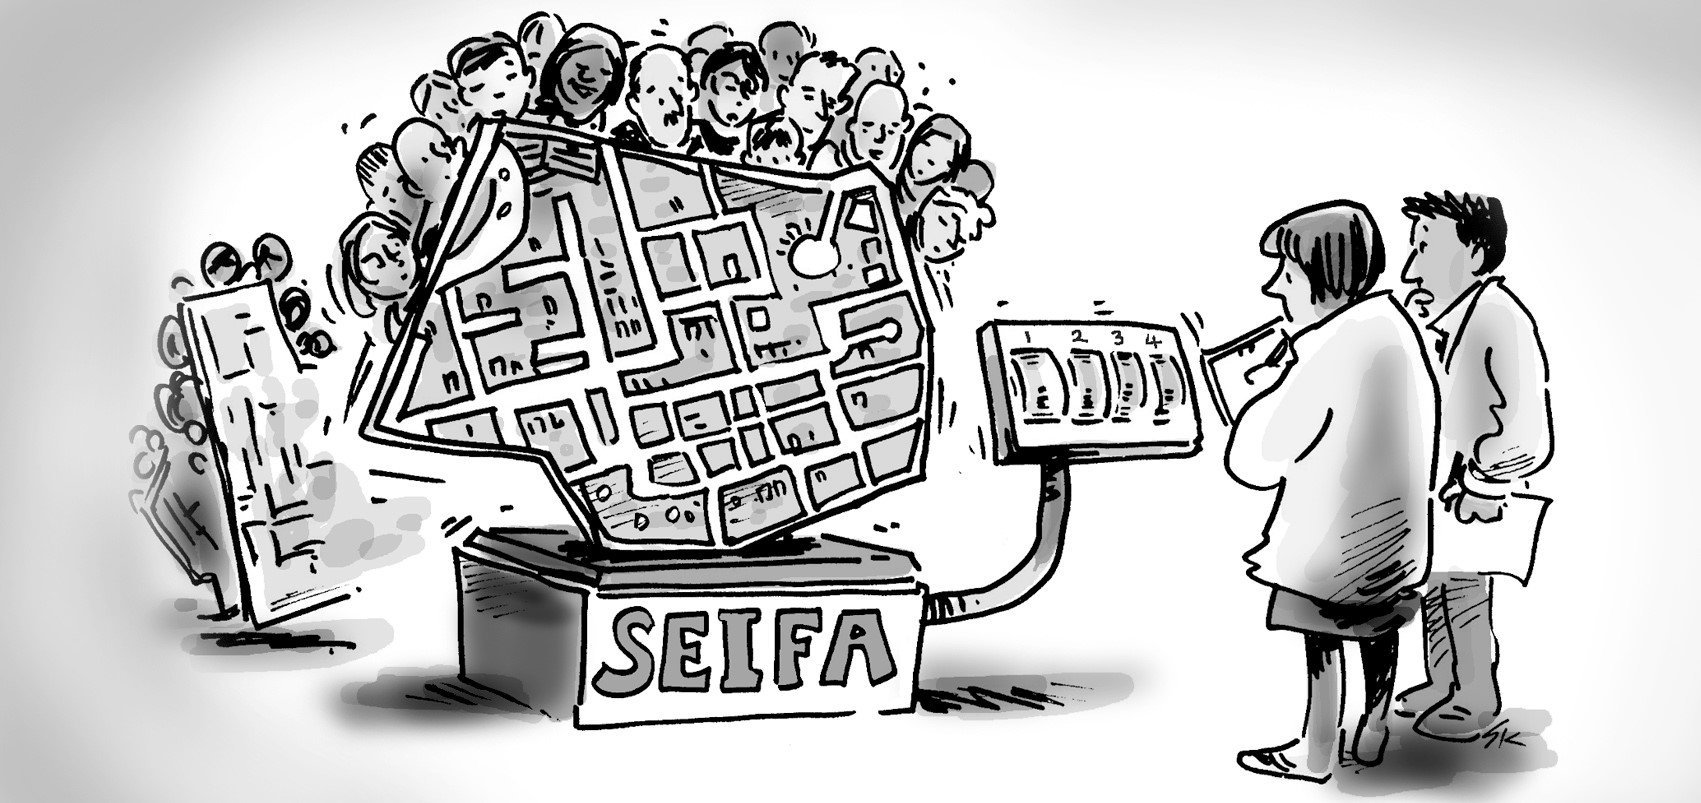
While population forecasts can tell you about the demand for aged care services over time, it is also important to look at this in the context of supply, and the demographics of the area (e.g. home ownership, house prices, socio-economic status and local amenity) as this impacts the operating model and viability of facilities.
.id work with clients in the aged care sector to triangulate this information and ensure aged care services are delivered in the right place, at the right time. For more detailed information, visit our website.
.id is attending the LASA National Congress 2016 in the Gold Coast from 9 – 12 October 2016. We are keen to talk to aged care and retirement living providers about the way demographic trends are impacting local areas.