Using population forecasts to project the health outcomes of suburbs
While there are well-documented links between health behaviours and health outcomes, there is also a growing body of work suggesting that the way we are designing and building our suburbs can have a significant impact on the health outcomes of our communities. We know that where people live should not limit what opportunities they have. But in many cases, it does.
.id recently undertook a project for the City of Geelong to explore links between local prevalence of chronic disease, unhealthy lifestyle conditions and built form.
This project was challenging, not the least because comprehensive and regularly updated health data is difficult to obtain at the small area level (LGA and suburb).
However, some data on health behaviours and health outcomes for the City of Geelong and most of its suburbs has been made available through the Geelong Osteoporosis Study (GOS) 2014. The availability of this small area health data became the inspiration for this project.
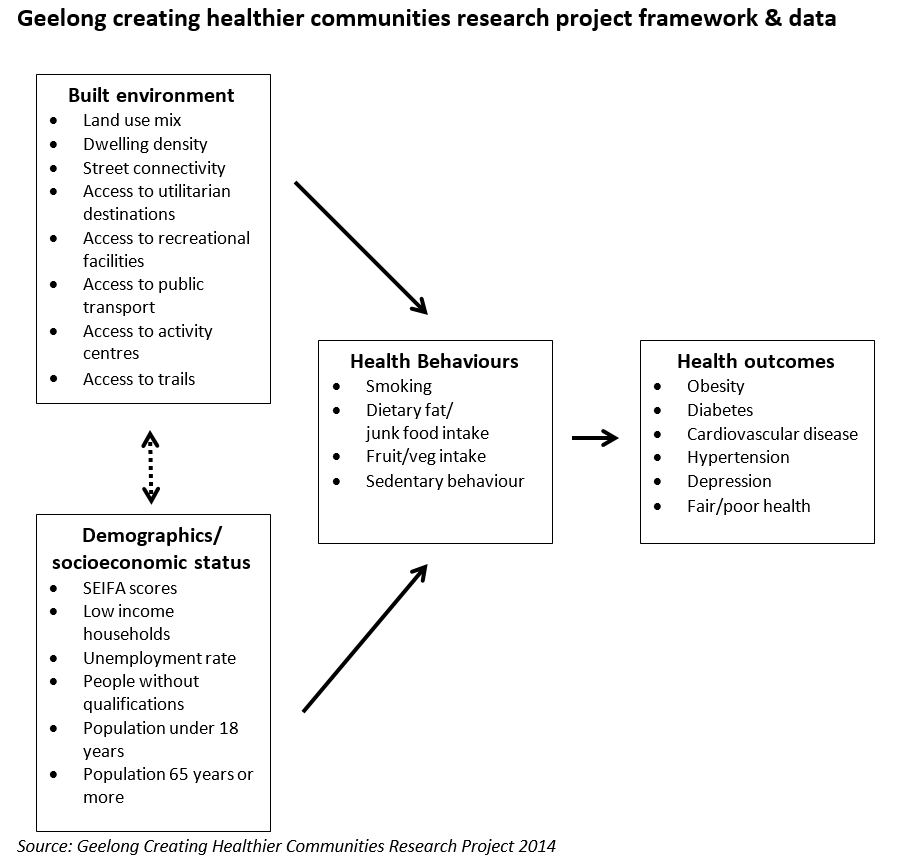
Project framework
The thinking underlying the structure for this project was guided by the following assumptions:
- Health behaviours lead to health outcomes;
- Health behaviours have a strong relationship to socio-economic status;
- Health outcomes have a strong relationship to age; and
- The built environment has an impact on the access to opportunities that people have to engage in certain health behaviours
Selected city-wide findings
Based on the GOS data, Geelong’s community health challenges include:
-
- More than a quarter of Geelong’s adult population (26%) is obese
- Eight percent of Geelong’s adult population suffers from diabetes, twice the state of Victoria rate;
- Nearly one-third (29%) of Geelong’s adult population suffers from some form of cardiovascular disease, more than twice the state of Victoria rate;
- 59% of the adult population suffers from some form of hypertensive disease;
- 9% of the adult population currently smokes;
- 28% of the adult population is sedentary and does not exercise;
- 18% of the adult population consumes either junk food or dietary fat regularly; and
- Based on future population growth in Greater Geelong and current age-specific prevalence rates, by 2031, the obese population will grow by over 12,100, the population with diabetes will increase by 3,300 and the population suffering from cardiovascular disease will grow by an additional 20,700 people.
With regard to the relationship between health outcomes and built from of each suburb and township, there is evidence of an association between higher density and higher levels of mixed use of the built environment and higher levels of physical activity, walking and active transport.
Correlations between the health data and built form data analysed for this project however were not conclusive. Nevertheless a case study approach provided an important context for understanding the evidence base and the potential for using health data to inform practice and decision making at a local level. The case study approach provided a more informed perspective on the data by understanding how the evidence applies to a place; who lives there; what are its built form characteristics; how has the place changed; and how is its function likely to change in future? Drysdale, a suburb of Geelong was selected for the case study and is presented below.
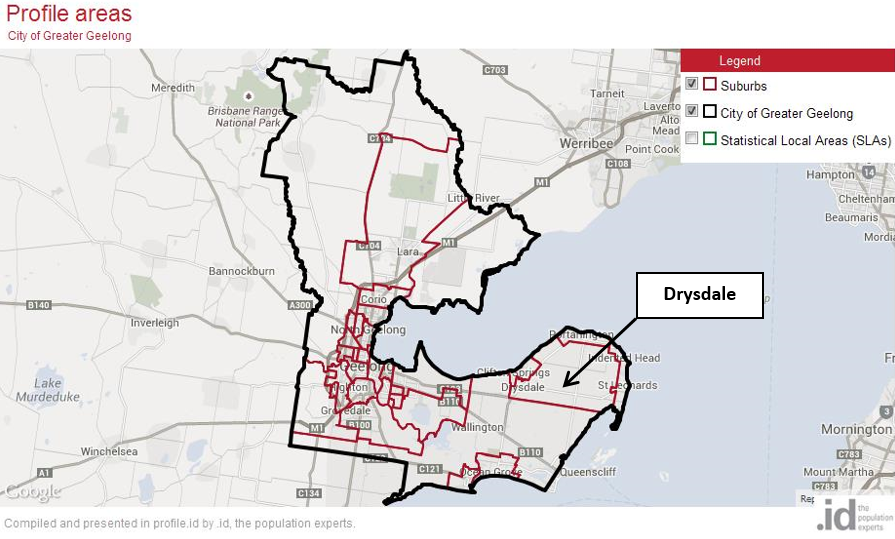
Drysdale, Geelong – a case study
Drysdale is a predominantly rural area on the Bellarine Peninsula in the City of Geelong, Victoria. It is characterised by suburban residential areas in the south-western portion of the suburb, which are essentially an extension of the suburbs of Clifton Springs. The most significant residential development of this area has occurred largely since the 1960s, but significant further development is forecast for the area.
The population of Drysdale is forecast to double from around 5,000 (currently) to 10,000 people by 2031. This increase is a result of continued residential development, attracting primarily family households and seeing large gains in retirees.
Drysdale’s forecast health outcomes
Using the Geelong City-wide age-specific prevalence rates for health outcomes from the GOS data and applying them to the demographic forecasts for Drysdale, the population with diabetes is forecast to increase by almost 200 people, the obese population by 703 and the population with cardiovascular disease, by over 1,200 people over the 16 year forecast period to 2031.
These health outcomes are strongly related to the health behaviours (or risk factors) of the Drysdale population. The chart below shows with regard to each of the three risk factors,(living in a sedentary lifestyle, smoking and eating junk food) the Drysdale population is above the Geelong average. This was also the case for the composite ‘health behaviour index’.
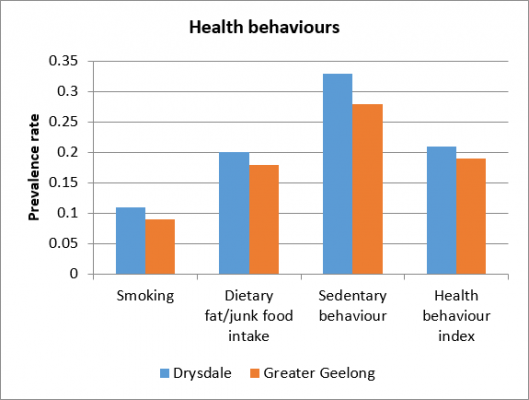
While these risk behaviours are in part related to the demographic and socio-economic status of people in Drysdale, it is important for Council officers to understand how they can influence health behaviours through build form and service provision priorities.
Drysdale’s current status
The table below includes a snapshot of measures bringing together health, built form and socio-demographic indicators into one simple table, benchmarked to the Geelong City average.
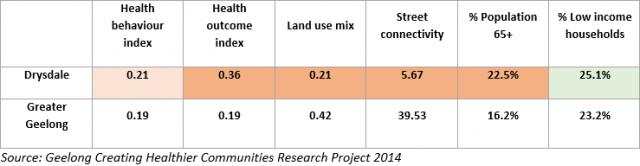
Drysdale scores relatively poorly on the health behaviour index and well below the Geelong average health outcome index. To some extent it reflects the fact that Drysdale has a much older population than the Geelong average, with relatively lower socio-economic status scores.
Drysdale also has a low land use mix and very poor street connectivity scores. This is, to some extent, due to the nature of the geography of Drysdale in that it includes a mix of suburban, semi-rural residential and rural land use.
Drysdale’s opportunities
While these indicators paint a picture of Drysdale as a place in need with regard to improving the health behaviours and outcomes of the local community, the possibilities for improvement for Drysdale lie in the opportunities presented by its future growth. As previously mentioned, Drysdale’s population is forecast to double from 5,000 currently to 10,000 by 2031, driven by residential development. Also, Drysdale is contiguous with the neighbouring Clifton Springs area (growing to around 9,000 people by 2031). This means that a significant critical population mass of some 20,000 local residents will support the development of the local town centre with more services, facilities and higher density living opportunities. With that Drysdale can expect more local jobs, better access to sports and recreation facilities, more diverse housing and better transport infrastructure. These are many of the built form factors that are required to provide people with better access to opportunity to engage in more healthy behaviours.
What emerged as valuable for local government officers was the ability to apply population forecasts to project chronic disease prevalence by suburbs out to 2031; and what those projections then mean for informing planning and decision making with regard to infrastructure and service provision. Having access to this extra layer of information for communities like Drysdale can actually trigger a review of scheduled infrastructure works.

Ivan - The Founder
Ivan is interested in how communities have access to education, housing, health, employment, recreation and each other. People in public and private organisations can be frustrated in their ability to contribute to this “good society” when they don’t have the right information to make critical decisions. Ivan’s idea is to introduce spatial thinking to organisations, look at places through a demographic lens, and use the power of storytelling to be persuasive. Today over 40 smart people have joined him in this mission. Each year over 1.5 million people use id’s 500+ web applications to inform their decision-making. Over 10,000 people subscribe to .id’s newsletter and over 50,000 learn from .id’s blog every month. Today over 30 smart people have joined him in this mission. Each year over 1.5 million people use id’s 500+ web applications to inform their decision-making. 10,000 people subscribe to .id’s newsletter and over 30,000 learn from .id’s blog every month. Ivan loves surfing, his family and the dog.