Population densities of Australian capital cities – Adelaide, Perth and Brisbane
Nenad - demographic consultant
09 Jun, 2015
In the previous blog, I described in more detail as to why population density analysis is important. This entry continues on from that and describes the population densities in Greater Adelaide, Greater Perth and Greater Brisbane.
Greater Adelaide
- Colonel William Light’s South Australian capital of Adelaide has grown from a planned vision to a state capital with an estimated population of 1,304,600 (in 2014, Greater Adelaide).
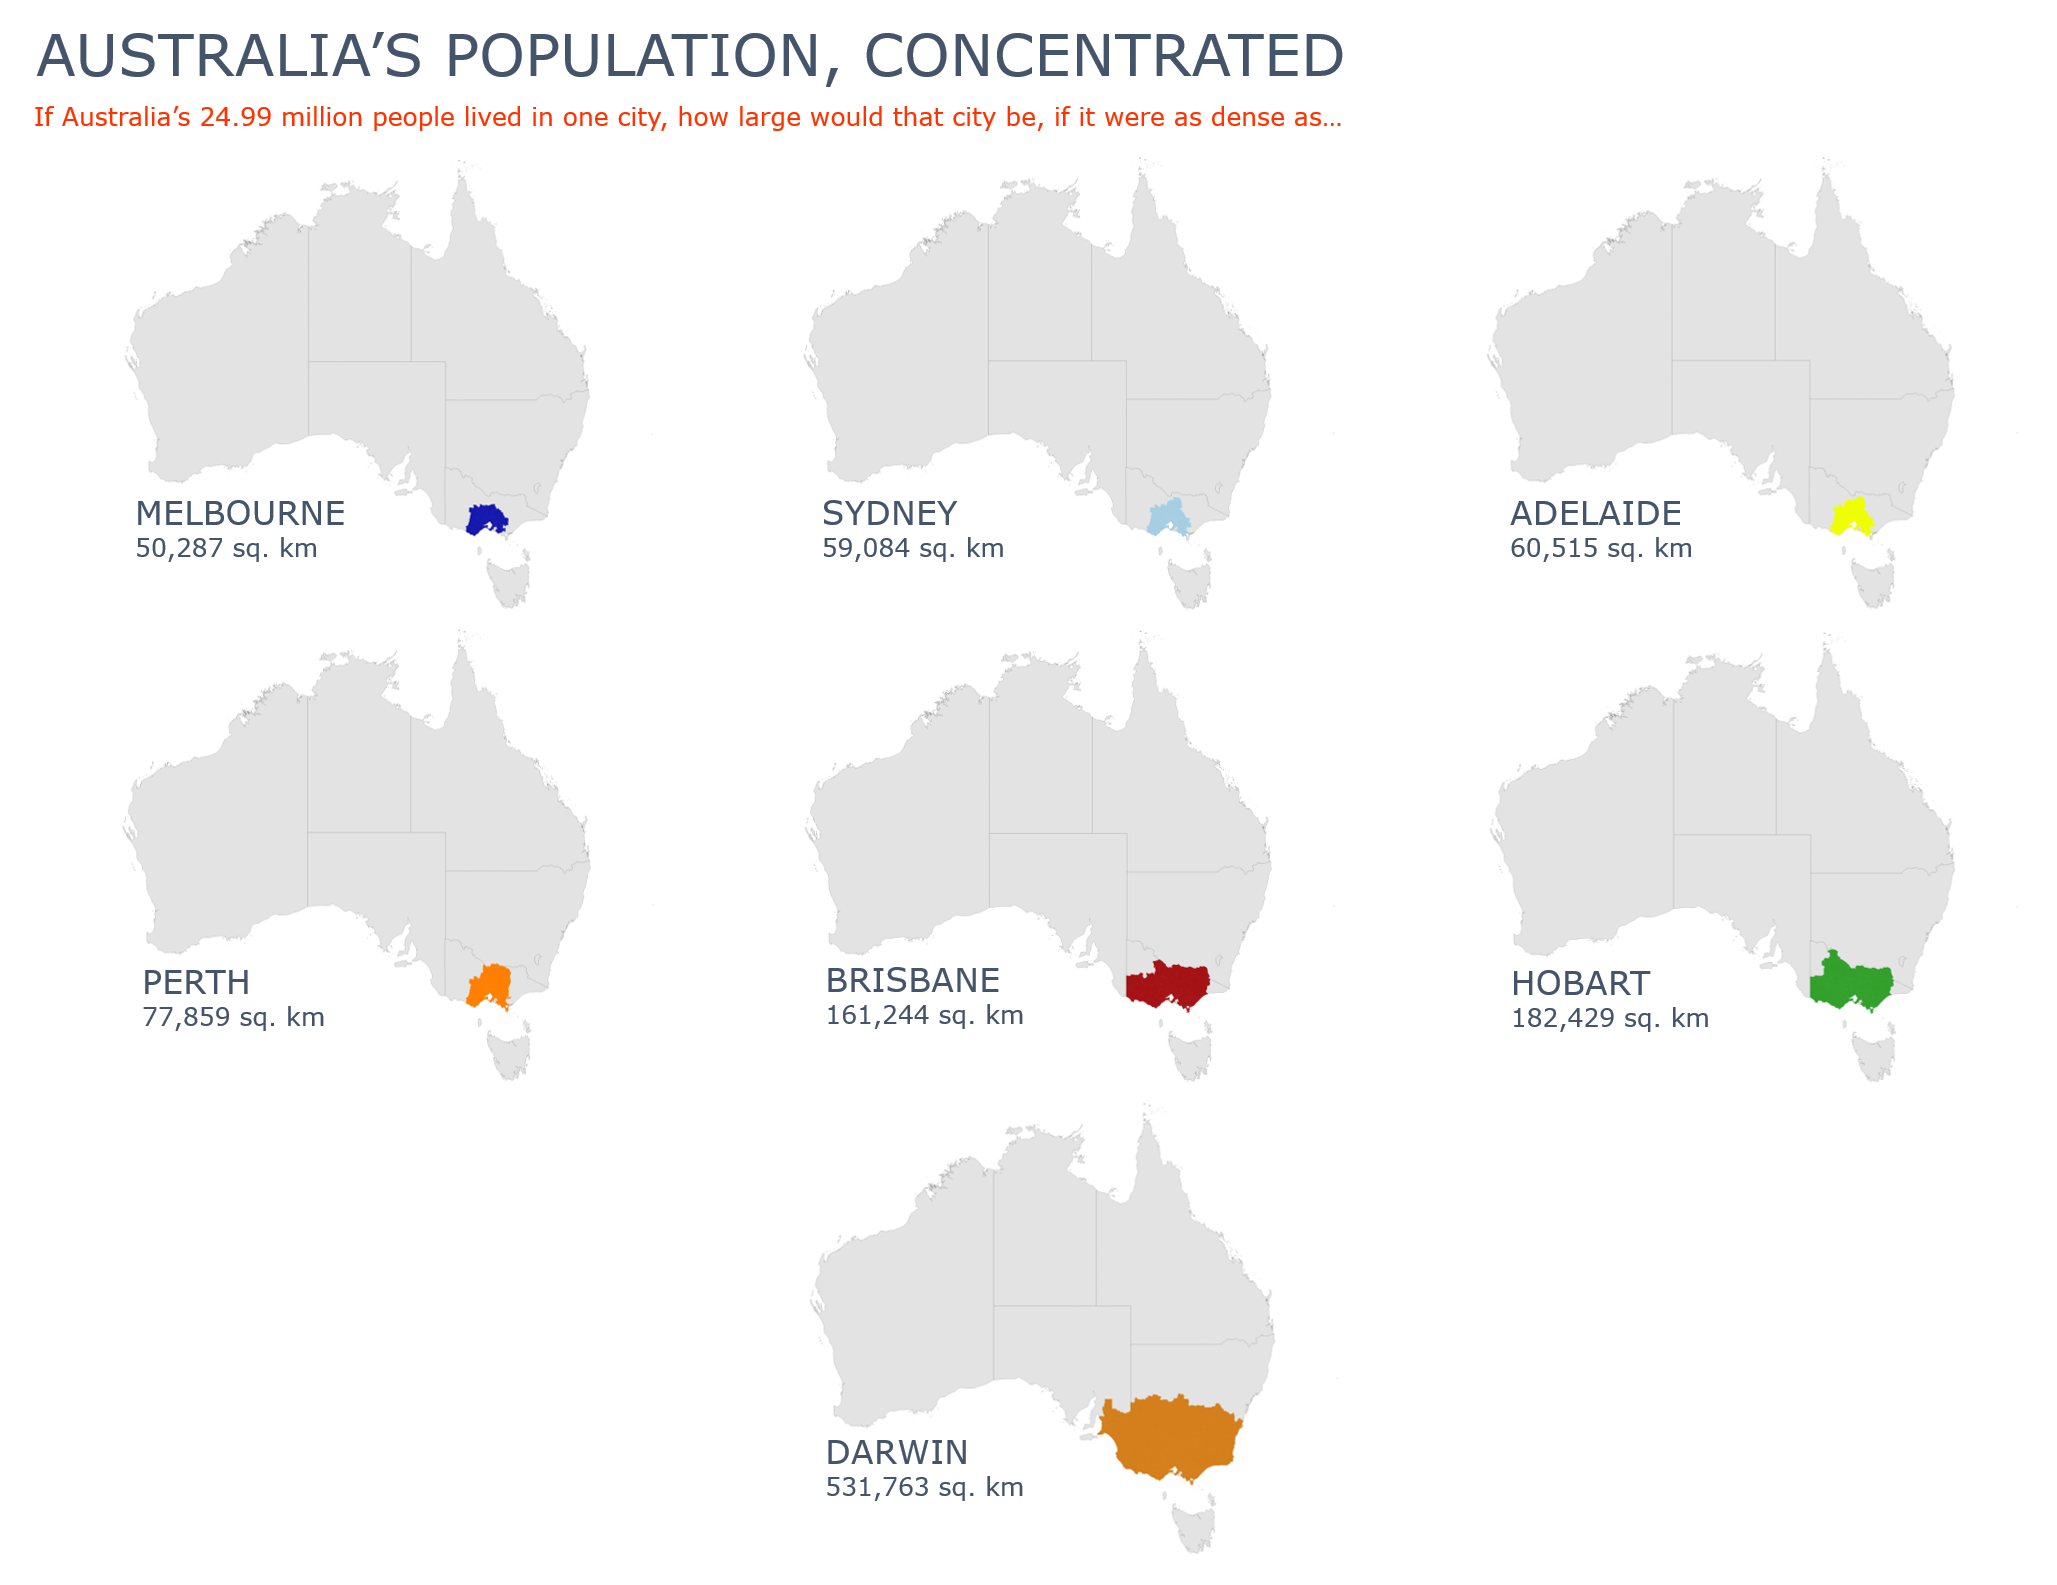
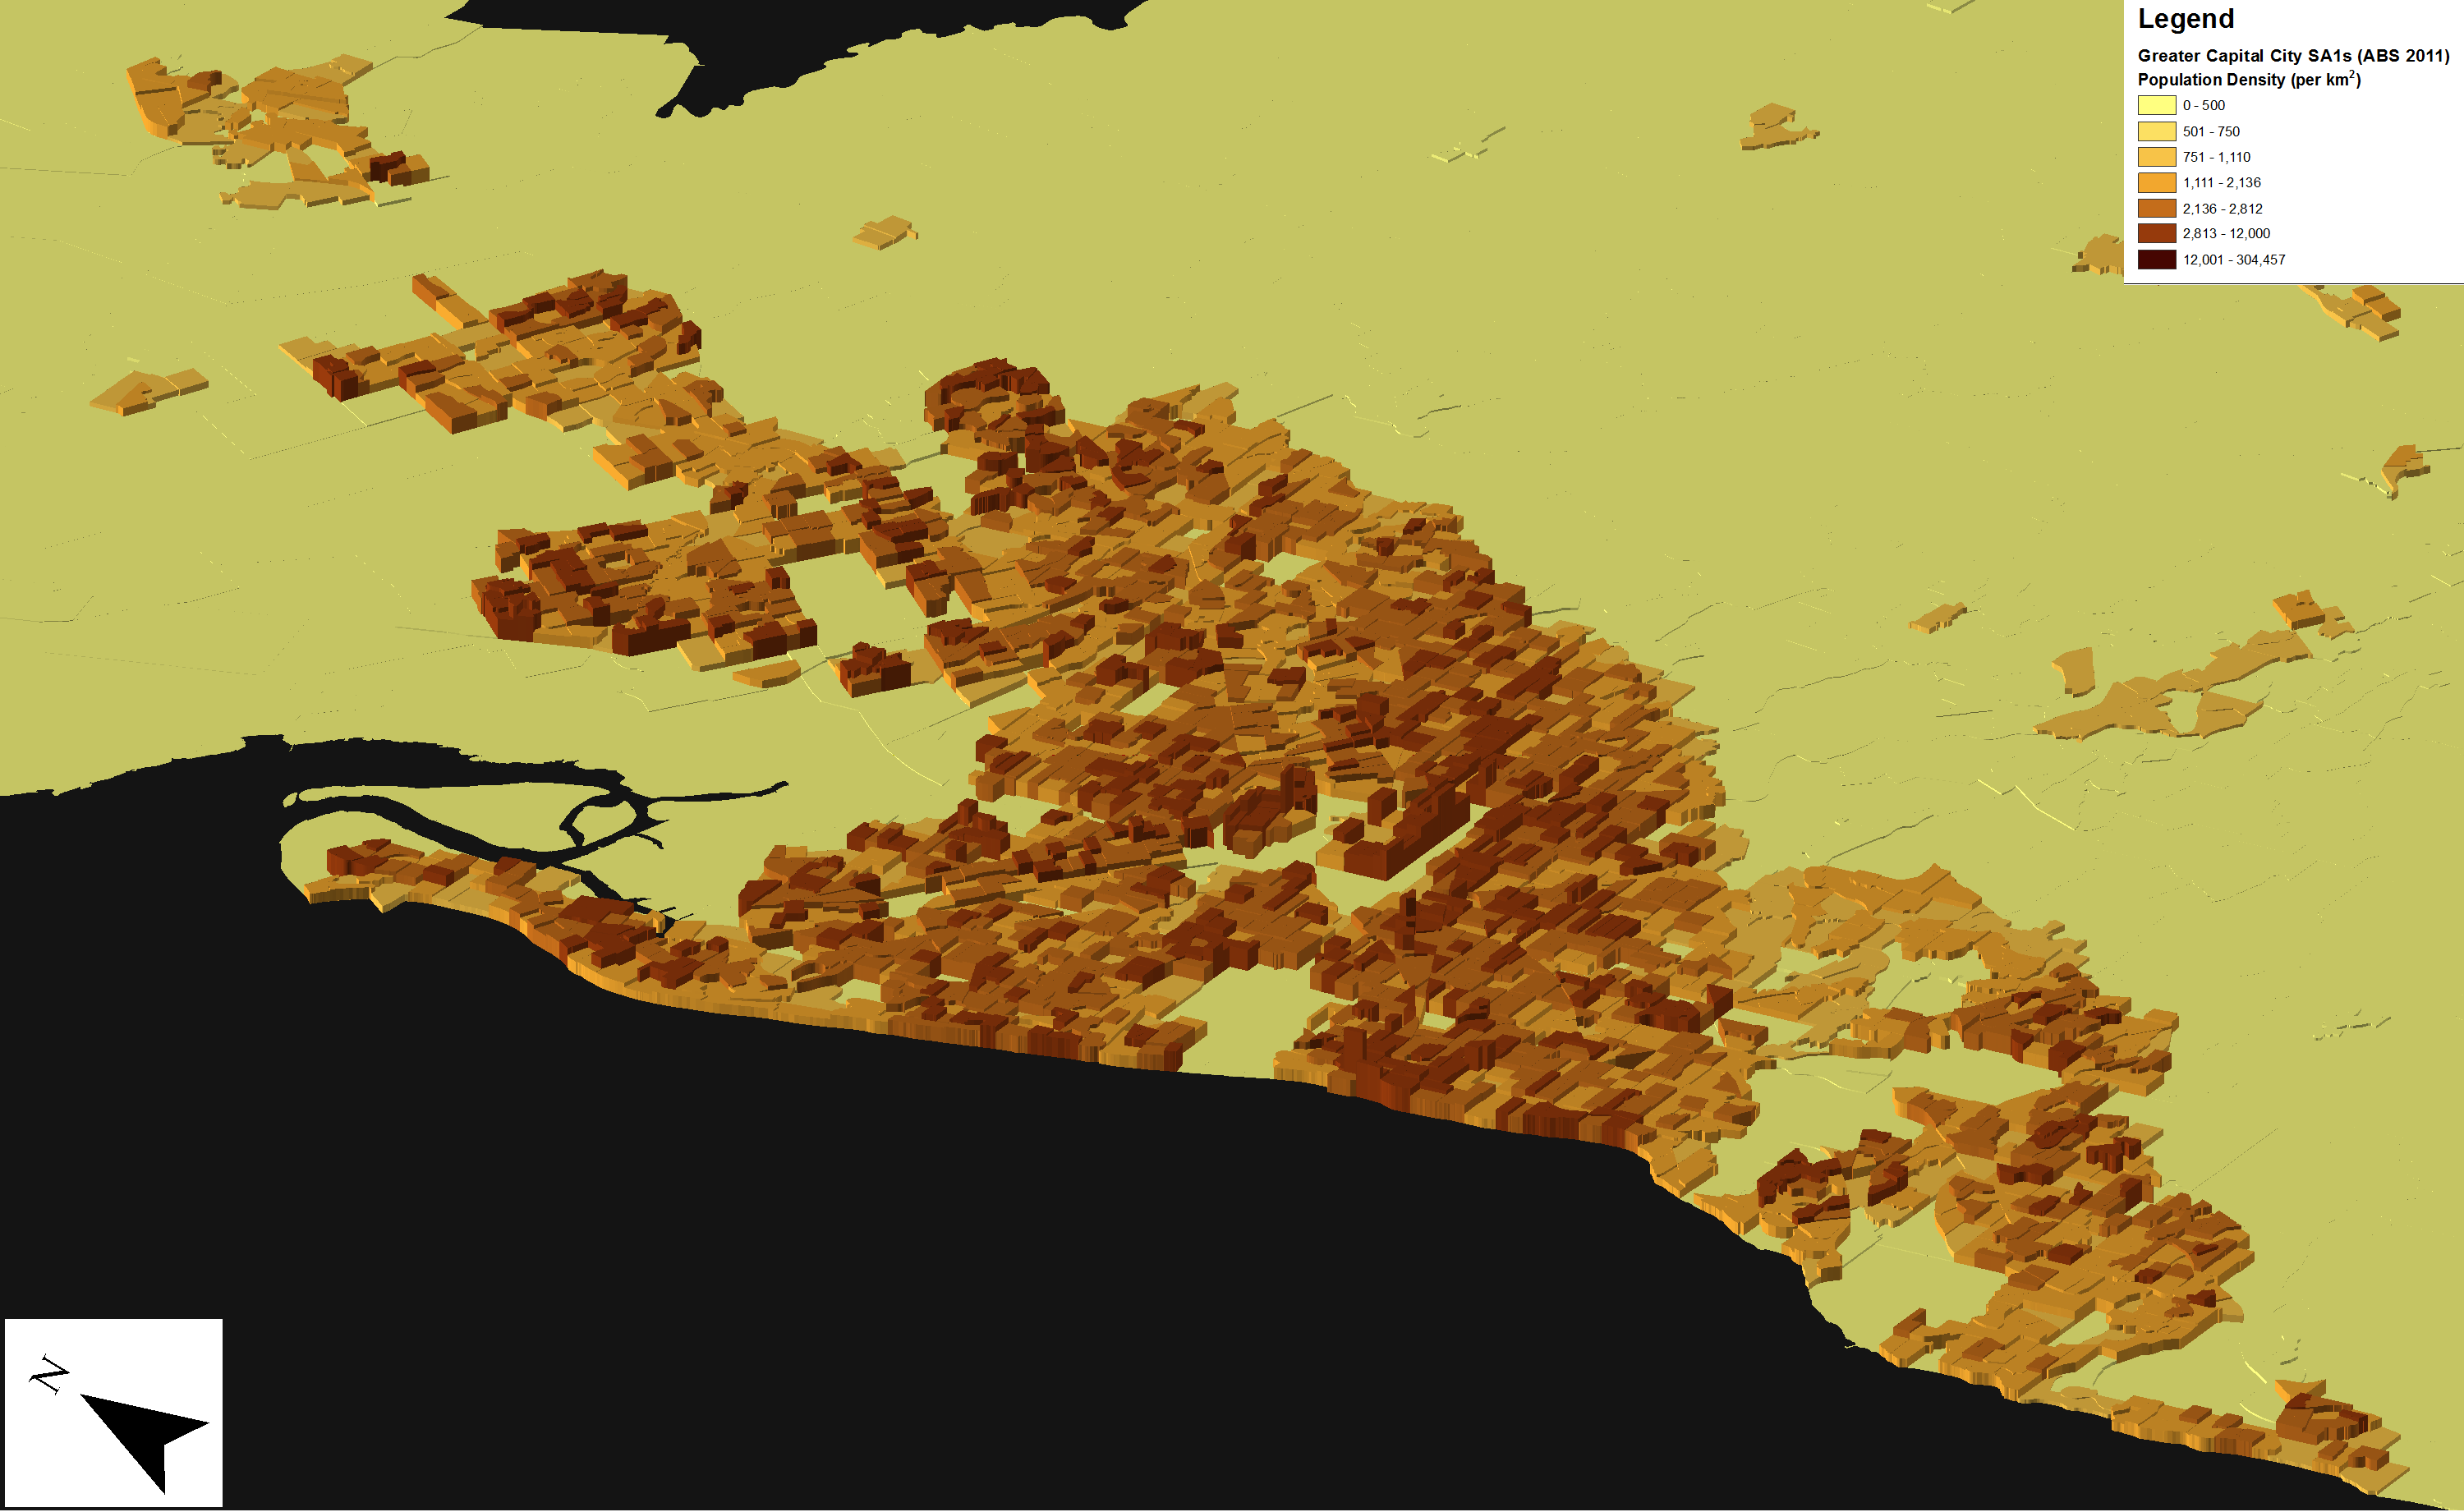
- Compared to the visually towering 3D maps of Sydney and Melbourne, which will be discussed in the next blog, Adelaide actually looks quite neat with no extreme clusters of highly dense SA1s soaring over others. This may suggest that Greater Adelaide’s population density would be quite low but when examined closely, the population density of 400 persons per km2 is actually higher than that of Greater Sydney – namely due to Greater Sydney having large areas of very low population to the west.
- The most dense SA1s are not just located in the City of Adelaide, as one might expect. Two SA1s, composed largely of apartment buildings in the City of Adelaide’s “South East Corner” have a combined population of 1,163 and a population density of 7,753 persons per km2.
- The City of Adelaide’s population density as a whole is 1,296 persons per km2 which is similar to Washington, San Diego or Portland in the United States of America. Without the parklands, however, Adelaide’s population density is quite high at 3,489 persons per km2, comparable to that of Durban (South Africa) or Vienna in Austria. If we look at our Community Profile, these densities can be explained by looking at dwelling types which show that in 2011, 87% of residents lived in medium or high density dwellings, with the number of high density dwellings increasing by 1,663 from 2006 to 2011 (from 31% to 41% of all private dwellings in the City of Adelaide).
- Other areas of Greater Adelaide which illustrate relatively high population densities are west of the City of Adelaide and include the suburbs of Largs Bay and Ethelton (in the City Port Adelaide), Semaphore Park and Grange-Henley Park (in the City of Charles Sturt) and the southern coastal strip of Glenelg, Sommerton Park and North Brighton in the City of Holdfast Bay.
Greater Perth
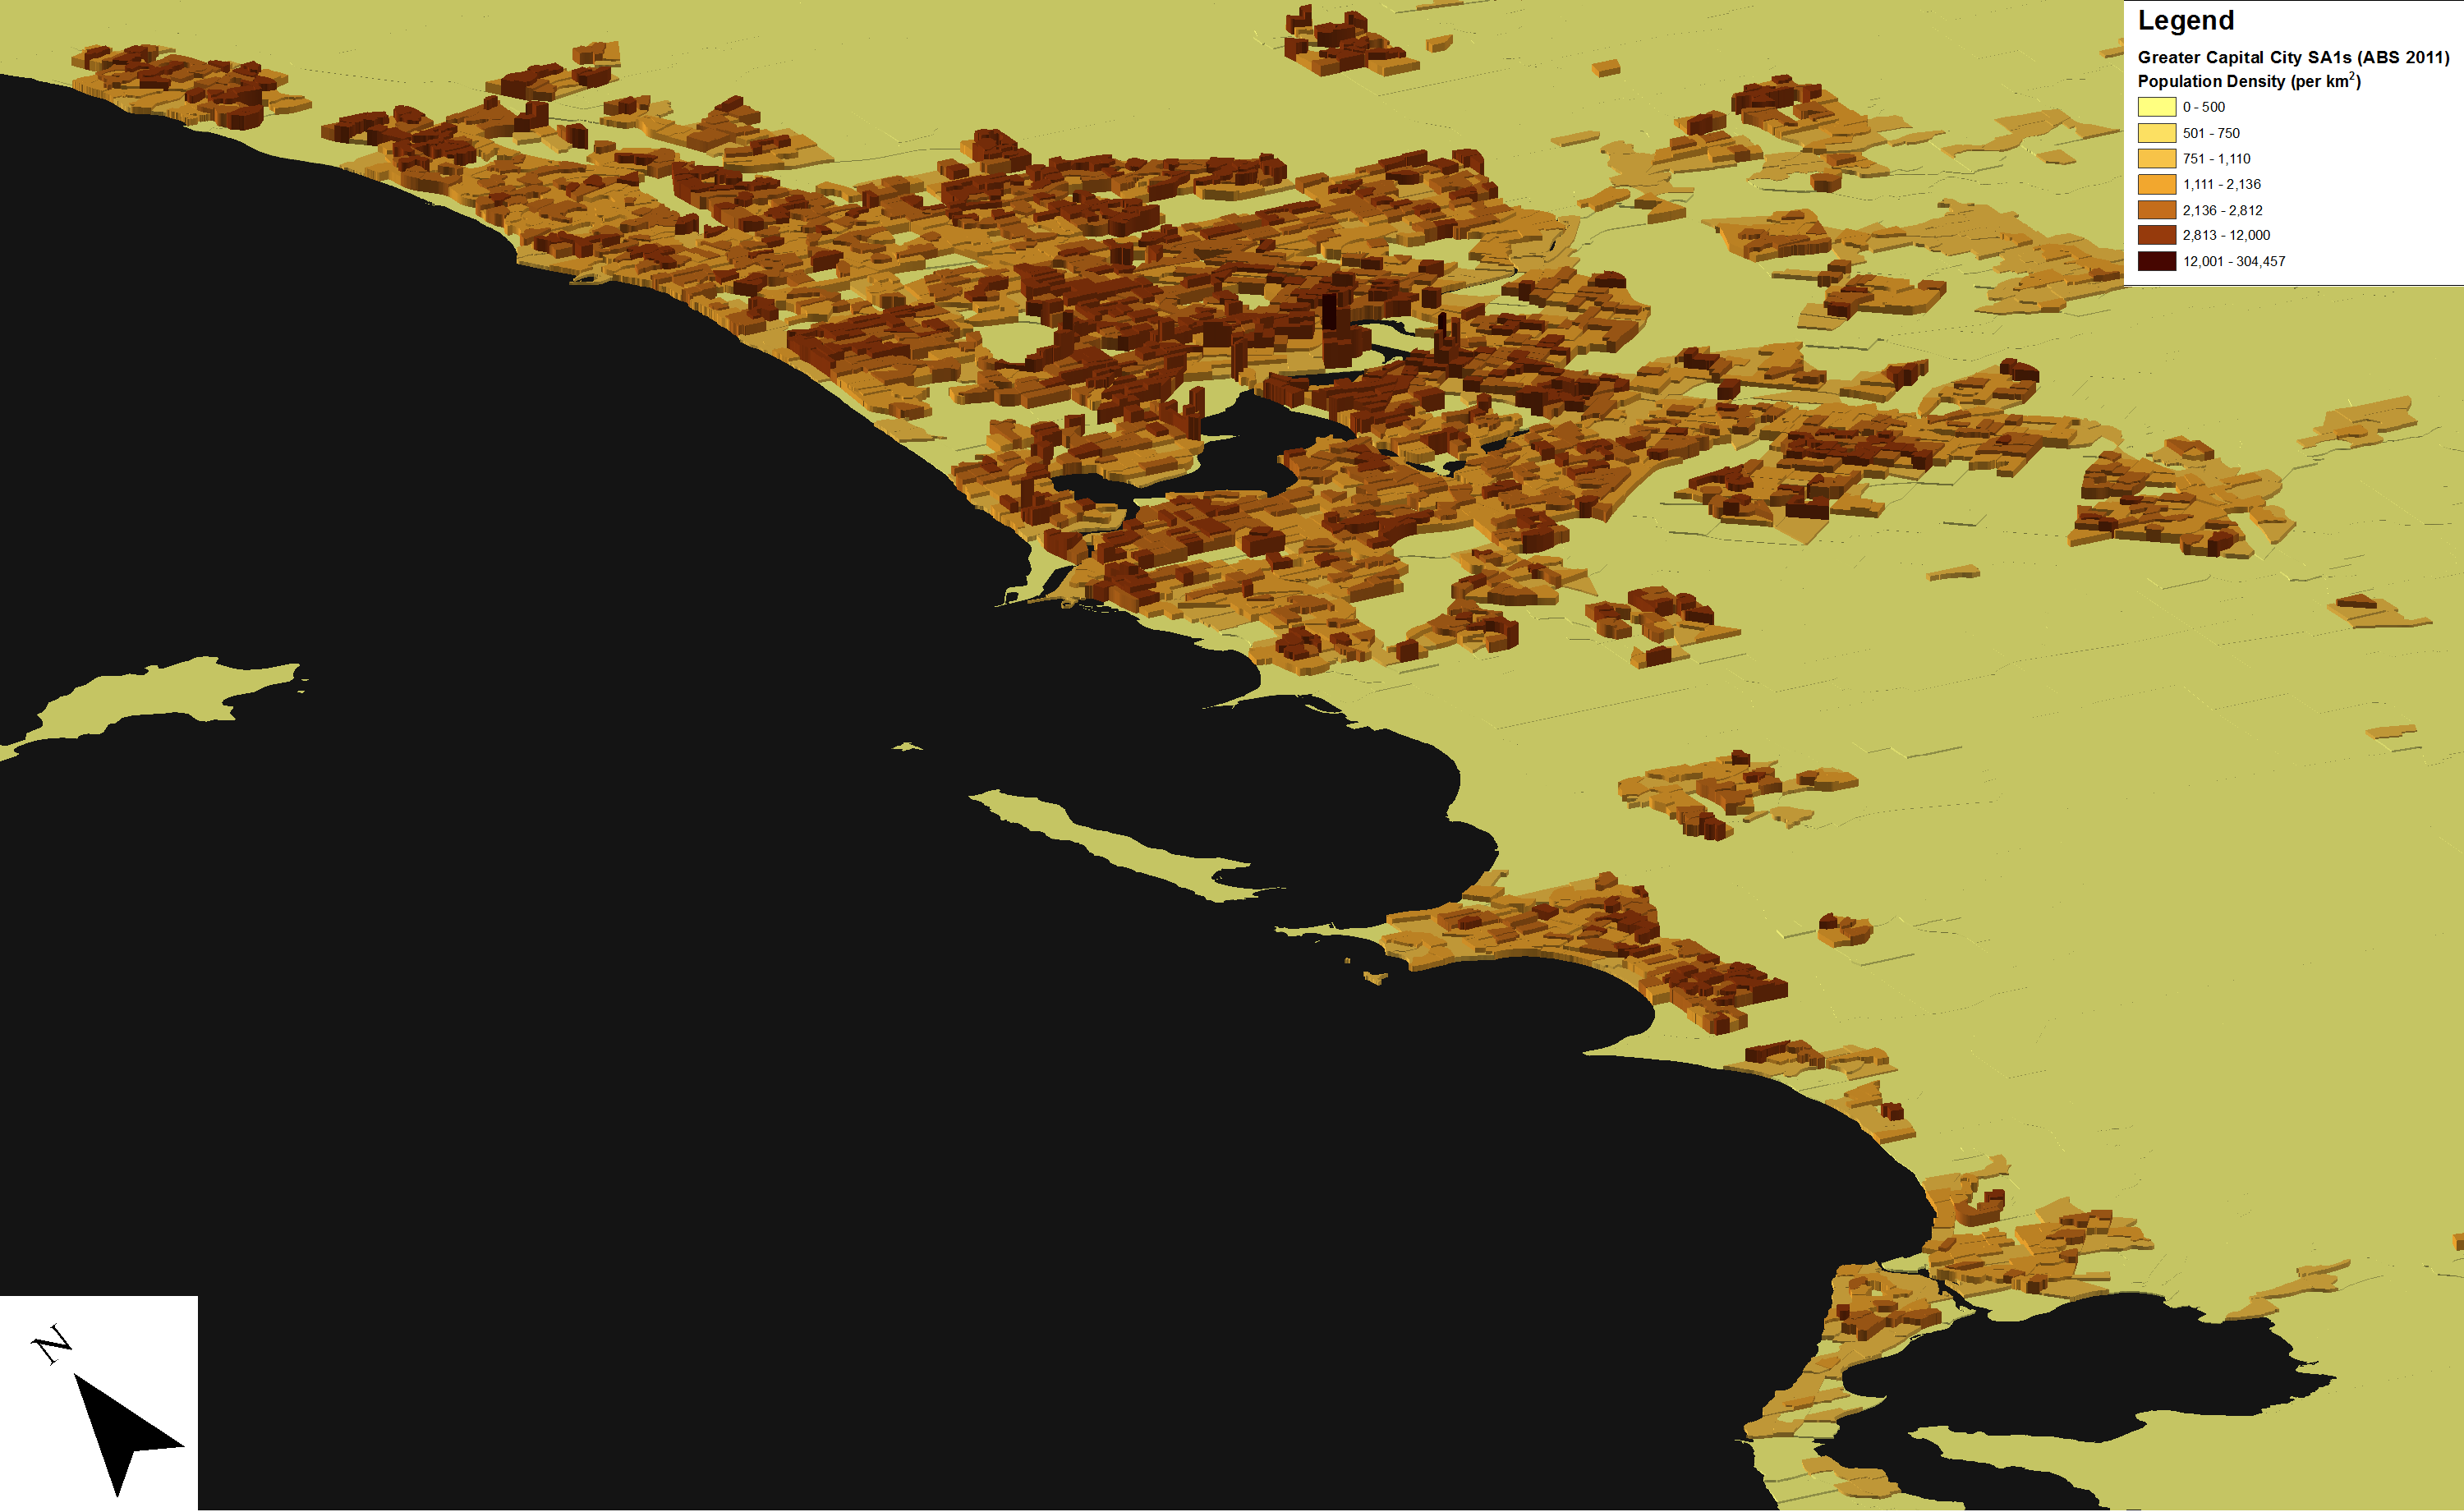
- Three of Greater Perth’s five most dense SA1s are located in the middle of East Perth, in a block bounded by Hay Street and Wellington Street which has a concentration of high density dwellings and a population density of over 10,000 people per km2. Our community profile for the small area of Perth shows that 94.3% of all dwellings in this small area are classified as high density.
- Two other SA1s with (usually resident) population densities of >10,000 people per km2 are located south of the Swan River in Victoria Park (again in an SA1 dominated by apartment buildings and multi-storey flats) and in Wembley, where several apartment buildings which comprise the “Moondyne Gardens” with a 2011 population of 627 equate a density of 12,870 people per km2 given that the SA1 footprint is only 0.048 km2 in size (48,716 m2).
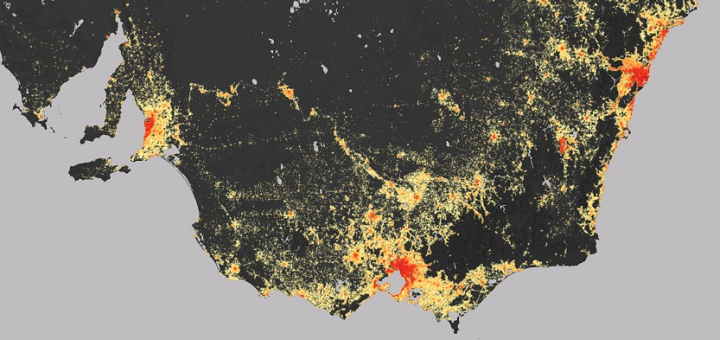
- The population density map of Greater Perth hugs the coast predominantly to the north of the Swan River Inlet with Freemantle immediately to the south of the inlet and the “satellite” footprint of Rockingham visible further to the south (which has a few surprisingly high density SA1s in Port Kennedy, namely around an aged care facility. Mandurah is also visible at the bottom of the map by the Peel Inlet.
- To the north of the contiguous Greater Perth corridor is a separate segment of moderately dense SA1s which stand out on the map are Mindarie, Clarkson, Quinns Rocks and Butler. Inland to the east are Kalamunda, Forrestfield, High Wycombe and Midland, to name a few areas.
Greater Brisbane
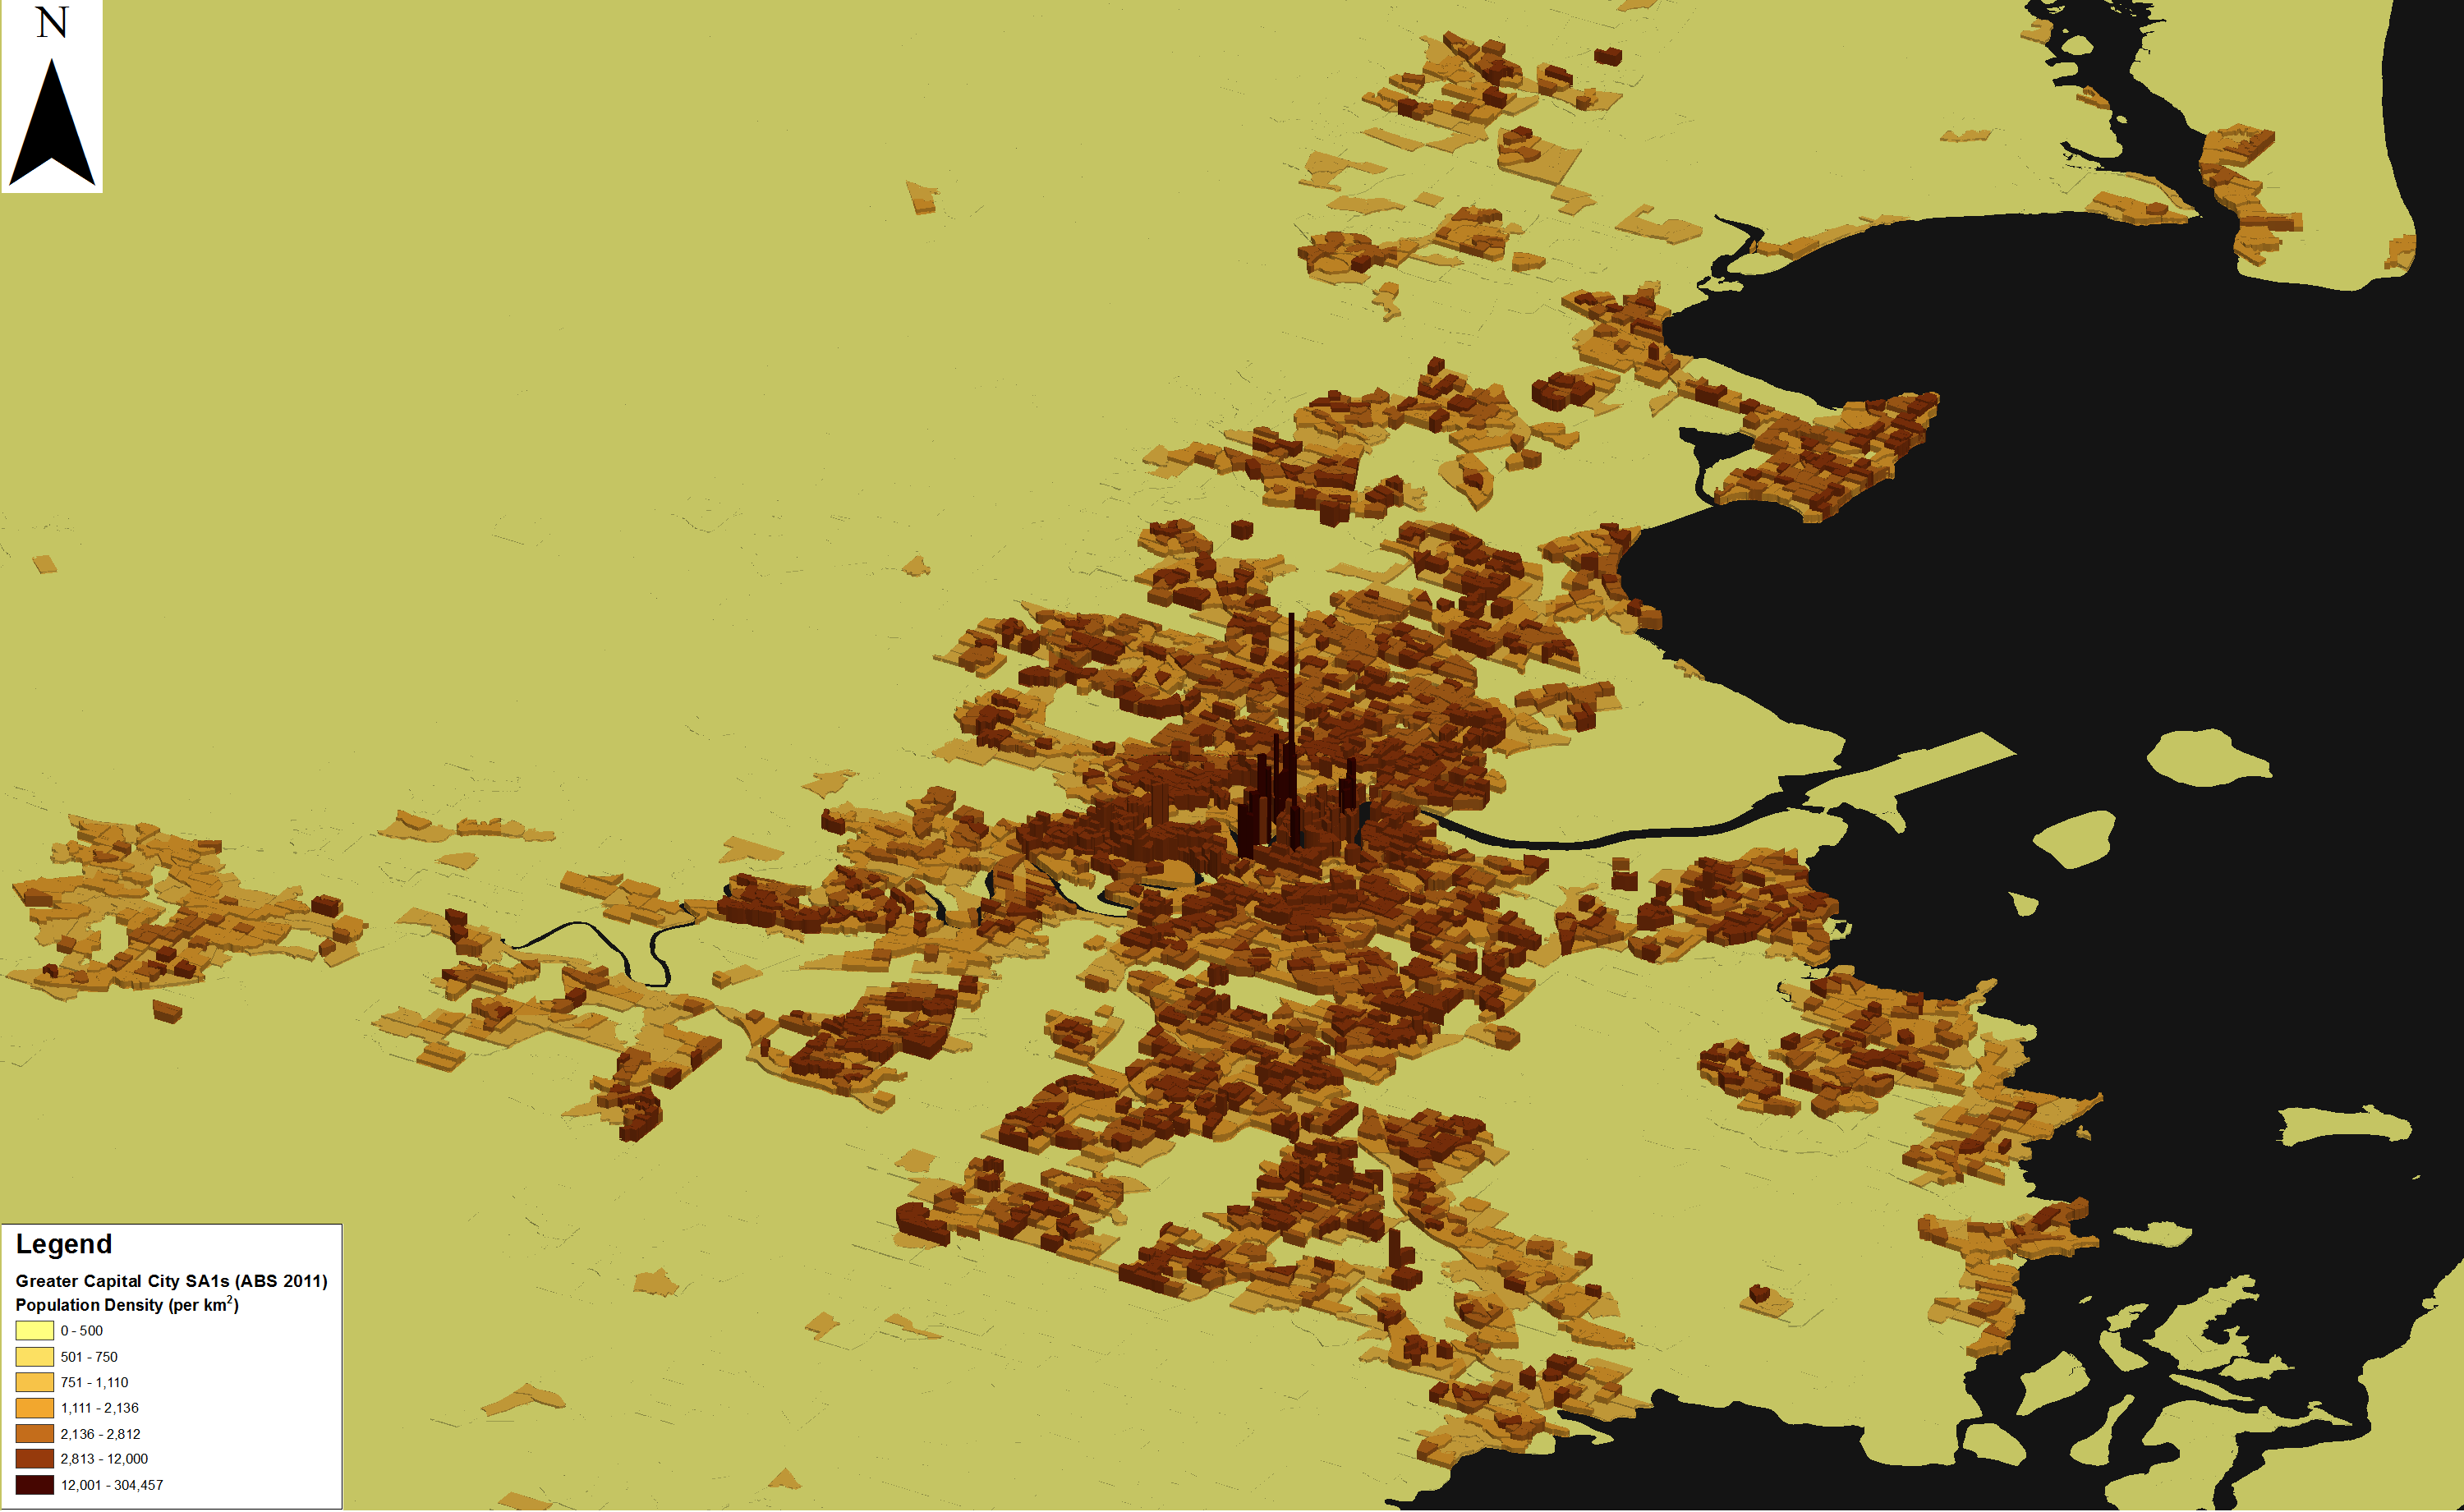
- The capital city of the maroon state looks quite impressive on a 3D population density map. Peripheral/suburban detached houses become more dense dwelling types as you travel further towards the city centre with a classic pyramid-type 3D profile of population density becoming higher around Fairfield, Greenslopes and Hawthorne (on the southern banks of the Brisbane River) and Toowong, Paddington, Spring Hill, St. Lucia and Fortitude Valley north of the river, to name a few.
- The population density in Brisbane’s CBD is approximately 4,800 persons per km2, similar to that of Barcelona. The densest SA1 in between Spring Hill and Fortitude Valley has a density of 64,125 persons per km2 due to it being high density dwellings (apartments) on an area of only 0.007 km2 (7,000 m2).
- Population densities seem to be almost radially symmetrical north and south of the CBD, with a mix of apartments, medium density townhouse/flat dwelling types. There are obvious restrictions to the east of the CBD, past Ascot with the airport and port inhabiting that part of the city.
- South of the Port of Brisbane, the suburbs of Wynum and Manly have higher density populations than their surroundings and even further south along the coast and predominantly to the east of Redland Bay Road are Victoria Point and Redland Bay with a combined Census 2011 population of around 28,000 (2013 = 29,209, based on SA1s). There is an interesting “block” of four SA1s inland (west) of Redland Bay which is a relatively ‘normal’ subdivision of stand alone houses (10-12 dwellings per hectare density). They stand out because most of the SA1 coverage is dwellings and roads whereas some of the lower density ones around them also include segments of bush/forest hence appear to have low population densities. This is a good example of how micro-level planning of suburban layouts/estate masterplans can influence population densities by simply including/excluding segments of green space.
- North of the outer suburbs of Brisbane (Brighton, Sandgate, Deagon, Bracken Bridge), the relatively densely populated settlement on the peninsula illustrates Redcliffe (Moreton Bay Regional Council), with a 2011 Census population of approximately 50,835 (2013 SA1 usually resident population = 51,847), with an average density of 2,018 per km2 (similar to New York City, USA).
- Logan City stretches south in a continuous urban corridor from Brisbane down to Mount Warren Park which borders Yatala, just outside the Greater Brisbane boundary.
- West of the City of Brisbane, along the river – Jamboree Heights and Forest Lake/Durack have several densely populated SA1s which are interestingly mainly stand alone houses even though the average population density in those suburbs is 2,835 persons per km2 – comparable to Dusseldorf in Germany or Brasilia in Brazil. Again interestingly, the entire central area of Ipswich (Ipswich, Raceview, Brasall), even when a few of the larger, less residentially zoned SA1s are excluded, only has an average population density of 1,226 per km2 – less than half the density of those two suburbs mentioned above.
In the third and final blog on population densities of Australian capital cities, I’ll look at the two remaining heavyweights, Melbourne and Sydney.
Nenad - demographic consultant
Nenad’s background is in geosciences and geographic information systems. At .id, Nenad has experience as both as a demographer and population forecaster. His areas of expertise are place-based analysis, identifying spatial patterns in demographic trends, community profiling, catchment analysis and an understanding of role and function of different communities.
Previous Story
Population densities of Australian capital cities