Population densities of Australian Capital Cities – Melbourne and Sydney
In part 1 and part 2 , I looked at the greater capital cities in order from smallest to largest with the two remaining ones being the heavyweights – Melbourne and Sydney.
Greater Melbourne
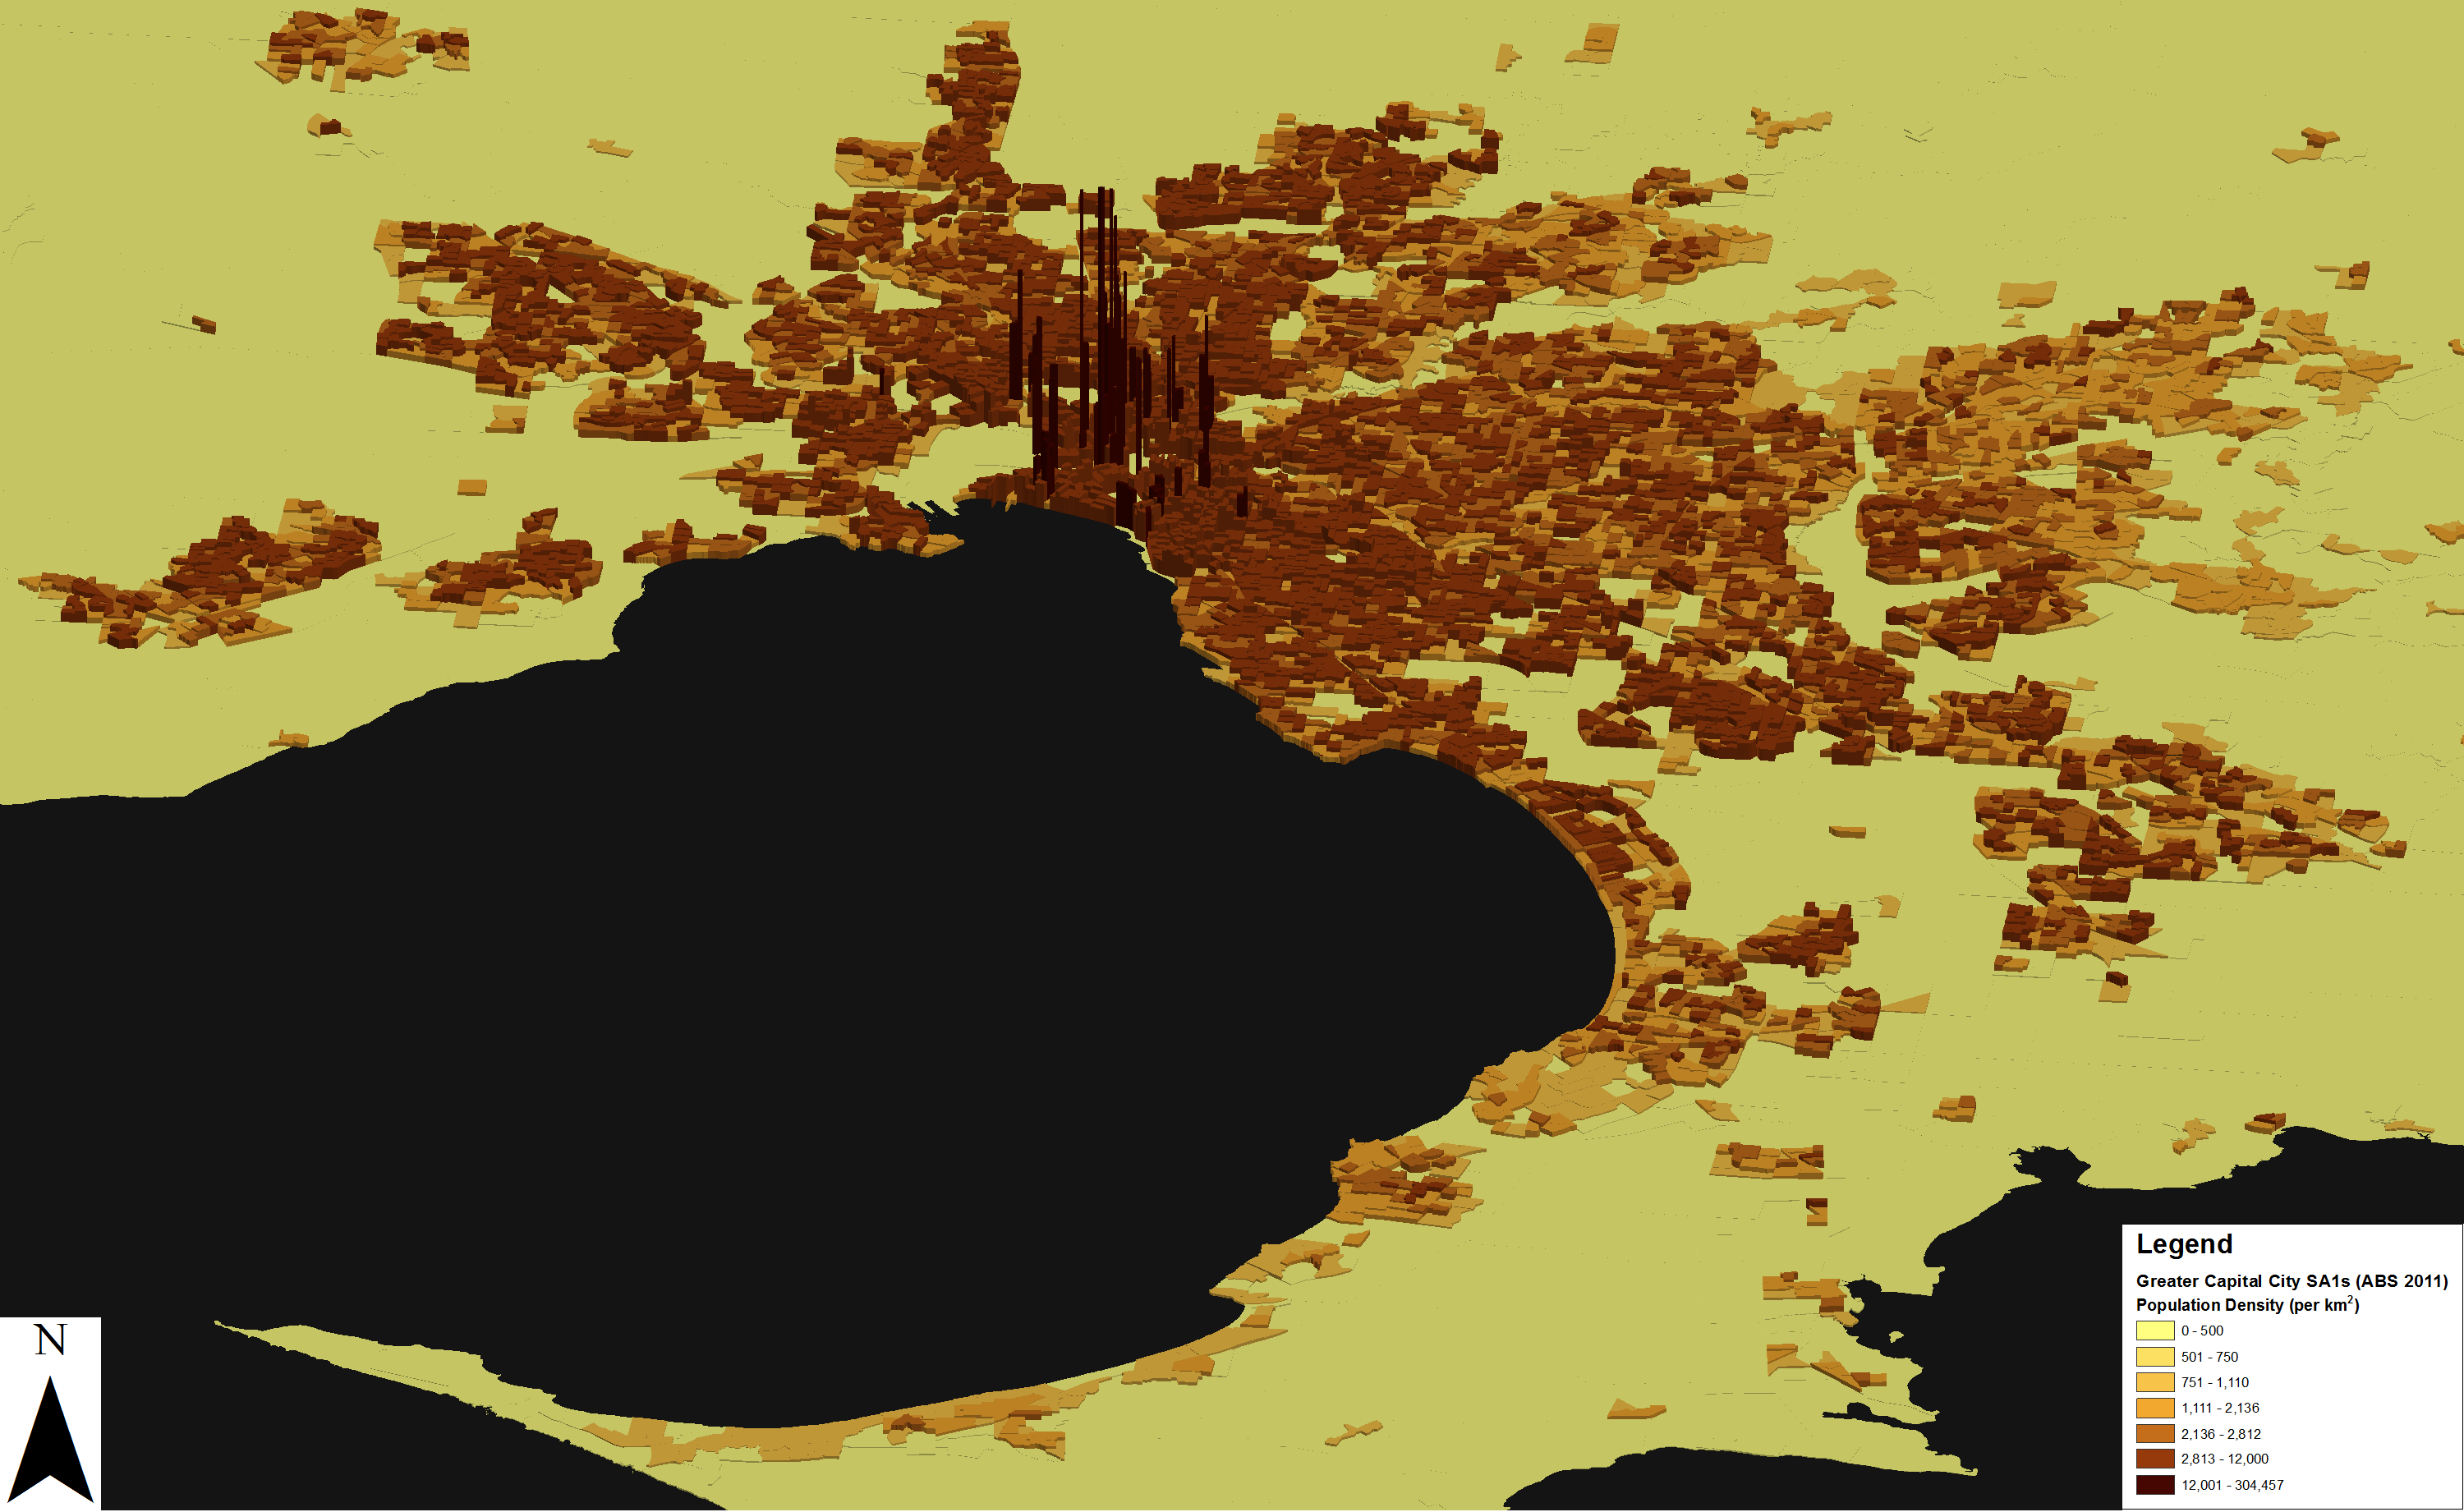
- Victoria’s sprawling capital of Melbourne may not have the largest “Greater Capital Cities Statistical Area” footprint (that award goes to Greater Brisbane with a footprint of 1,585,000ha/15,850 sq.km) but within the 998,500 hectare/9,985 sq.km footprint lies a population of 4,400,300 (2014p), second only to Greater Sydney’s 4,840,600.
- It is amazing how large a part geography/topography can play in dictating the type of growth a city exhibits. Sydney, more hilly and constrained by coastal boundaries means that central high density growth is more intense and greenfield growth is forced to occur only in areas where geography and land availability allows for this – the outer west whereas in Melbourne, geography is not as much a constraint for outer growth as is planning and strategic limitations/guidance. By our classification, only 40% of new housing development between 2006 and 2011 was in what we called the ‘outer suburbs’ of Sydney. This compares with a figure of 57% in Melbourne – as explained in further detail in our ebook titled “Predicting the Australian growth hot spots“.
- Inner Melbourne, although not as densely populated as Sydney, still has several areas which display anomaly-type population densities when compared to the rest of the central city. For example, in South Melbourne and Port Melbourne – several blocks (bounded by four SA1s) consisting of mainly apartment buildings have a population of over 2,600 persons and a density of 17,860 persons per km2 – the rest of Port Melbourne, Albert Park, South Melbourne and extending southeast to Middle Park have consistently high densities of 2,800-6,500 persons per km2 (comparable to the densities of the entire cities of Dublin, Ireland or Rio de Janeiro, Brazil). Collectively, the SA1s in these suburbs had a 2011 population density mean of 5,850 persons per km2 – slightly higher than the population density of the city of Athens, Greece and slightly lower than that of Guadalajara, Mexico.
- A coastal population density ‘spine’ is visible on the map as it follows the shoreline of Port Phillip from the mentioned suburbs of St. Kilda, down part Beaumaris, Chelsea, Seaford eventually reaching and heading inland near Frankston. Further south from here, Mornington is also visible as a relatively developed settlement with a population density of approximately 1,700 in the main township area – similar to the density of another seaside part of the world popular for its sand and sea – Miami, USA.
- Other inner east and southeast suburbs such as South Yarra, Prahran, Windsor, St Kilda, down to Armadale and Caufield in the south and Richmond, Abbotsford, Hawthorn and Kew in the east display similar population densities as other established parts of Melbourne – the dwelling type mix in these suburbs has changed over time from stand alone or semi attached Victorian villas, to slightly more dense townhouses and flats/apartments and nowadays to modern higher density apartment buildings, near existing transport corridors which all amount to higher population densities.
- In the Melbourne CBD as well as south of the Yarra River in Southbank and north of the CBD, in Carlton and Fitzroy, – the “spikes” of very high population densities are a result of additions of large, high-rise apartment buildings over time which in certain cases have a population of over 600 in an SA1 the size of only one apartment building (albeit a building with over 300 apartments). Many of these high density SA1s illustrate very high increases in population (and therefore pop. density) as high-rises are built and quickly populated. One four-building block of SA1s in Southbank has a population of 3,039 (661 ten years ago) and a population density of 161,164 persons per km2 (35,159 ten years ago, almost a five-fold increase).
- While I was writing these blogs, an article in The Age titled “A Forrest of towers: booming precinct goes from hundreds to thousands in decade” caught my attention as it discussed what I was describing here – large increases in population (as a result of high-rise apartment development) in certain parts of central Melbourne with an emphasis on the growing concern that development and growth in these areas may be outpacing the improvement of infrastructure such as public transport accessibility/capacity or footpaths.
- A few blocks of high-density developments in North Melbourne, Collingwood and West Richmond also appear on the 3D map – some resulting from high density developments from the late 1990s/early 2000s, others (e.g. North Melbourne) mid-2000s developments which have “densified” some parts of these suburbs (e.g. Carlton, Fitzroy, Collingwood) and several (some already mentioned) developments in Southbank and South Wharf, developing in the late 2000s and increasing population densities in the area.
- Most inner suburbs and middle suburbs of Melbourne illustrate similar population densities with diverse mixes of dwelling types in many LGAs. For example the City of Moreland has an increasing proportion of high density dwelling stock (see here) as is the case in other increasingly densifying LGAs such as Maribyrnong City (to the west of the CBD) or the City of Stonnington (east of the CBD) – all increasing in dwelling and therefore population density over time with the forecasts expecting these trends to continue in the inner and middle suburbs/LGAs of Melbourne.
- As far as outer, greenfield growth areas are concerned – we can see northern pockets of population density in the Cities of Hume and Whittlesea – areas which have experienced a combined population increase of 76,472 in the 2001-2011 period. In a decade’s time, as greenfield development continues in these LGAs – the combined population growth for the Cities of Hume and Whittlesea is forecast to be 132,190, a change in population distribution patterns that will be clearly reflected on maps such as these.
- In the east, the City of Casey can currently be seen on the map (far east of the map). It is expected to continue to grow at a steady average annual rate of 2.41% out to 2041 (almost doubling in population from 2011 to 2041). Even further east, the Cardinia Shire will change the landscape of Melbourne’s population density even more with continuing greenfield development and land availability resulting in large population increases.
- In the west, the existing areas of mixed population densities such as Brimbank, Maribyrnong and Moonee Valley will in the future extend out towards Melton as greenfield development towards the west increases and along with the existing growth in the City of Wyndham (southwest section on the map), these areas will become the largest growth fronts of urban sprawl and greenfield development in Greater Melbourne.
Greater Sydney
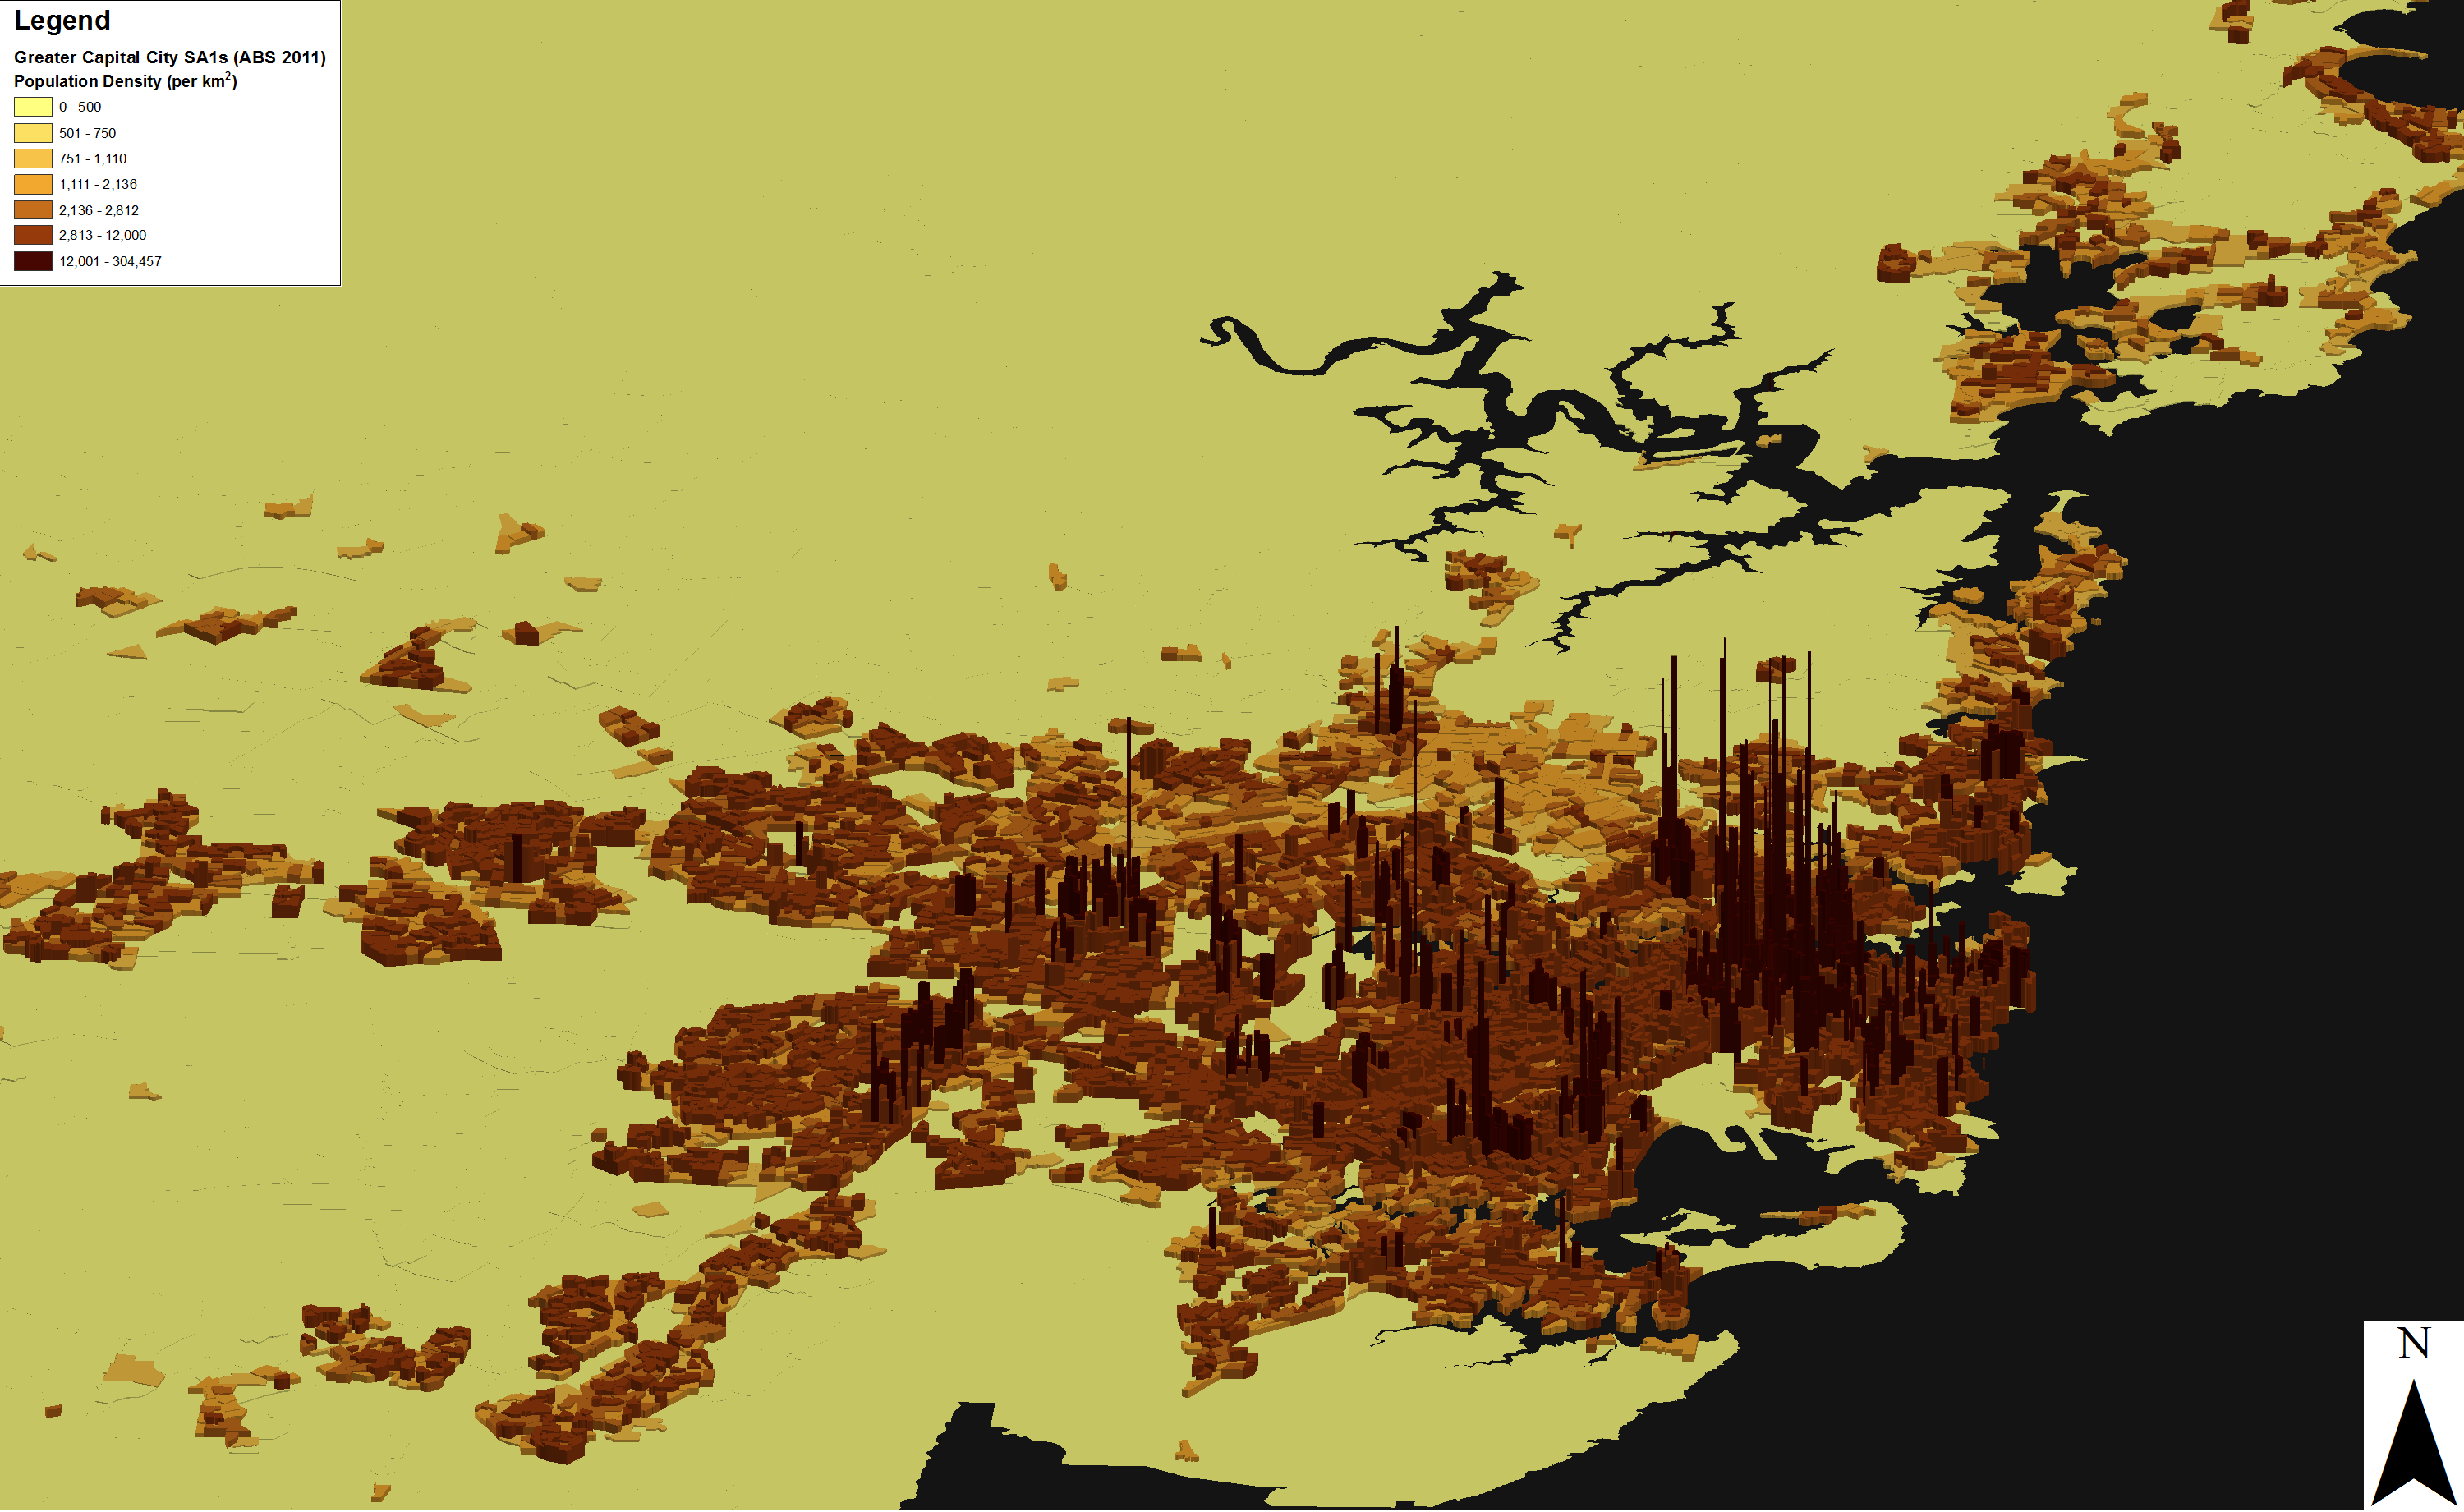
- Sydney is Australia’s most densely populated capital city. The 3D map with extruded densities speaks for itself.
- The 2011 SA1 based statistics indicate the population of Greater Sydney to be 4,608,949 and the 2014 preliminary estimated resident population to be 4,840,600 (source). The population density of Greater Sydney, based on the population density figures of the 10,842 SA1s in the area is 390 persons per km2
- Just within the central Sydney suburbs of Ultimo, Pyrmont, Surry Hills and Potts Point – there are 184 SA1s with a population density higher than 10,000 persons per km2. Of those, 89 have a density higher than 20,000 persons per km2 and five with densities of over 100,000 persons per km2 – those are all small SA1s which in most cases cover just the footprint of the high-rise apartment building/s with high populations (~300-2,000 persons). I wouldn’t be surprised if SA1 11703133712 (ABS 11-digit SA-1 code) was split up into two or three smaller units by the ABS in the future as the current population of the area (which encompasses a few apartment buildings) of approximately 2,199 in 2013 (2,156 at the time of the last Census) is the highest by far of all SA1s in Greater Sydney.
- What else does the 3D map tell us, other than the fact that inner Sydney is a very densely populated place? North of “the bridge” for example, there are several areas along the M1 corridor which are highly populated areas – commercial/retail/residential activity centres such as Chatswood and St. Leonards in the City of Willoughby and further south, closer to the area zoned “Mixed use” around Milsons Point in North Sydney – with high rise apartment buildings wedged between Luna Park and the M1. Even the suburb of Artarmon has a few blocks of densely populated SA1s which stand out from the surroundings which tend to be mainly low-medium density stand alone housing or 3-5 storey flats.
- On a macro scale, most of Greater Sydney, out to Parramatta and Liverpool maintains a relatively high density of population – roughly around 4,300 persons per km2 which can again be compared to the population densities of Stockholm in Sweden or Warsaw in Poland (link). The western urban corridor stretching from Blacktown, through to Penrith is clearly visible on the map, surrounded by large, low pop. density areas. The western-most cluster of population is Blaxland while to the south of Liverpool is the City of Campbelltown which weaves around either side of the Hume Motorway (M31).
- North of the Parramatta River, the population density of places decreases, with Ryde and Hornsby having relatively low densities compared to their southern neighbours although there are a couple of exceptions in activity centres such as Eastwood (in Ryde) and the central Hornsby corridor along Pacific Highway.
- Sydney’s famous beaches are also densely populated places – from Coogee up to North Manly and Dee-Why, the density of all SA1s just under 3,650 persons per km2 (roughly the population density of Riyadh in Saudi Arabia – link). Once you escape this hustle and bustle and get further north to Newport, Avalon Beach or Palm Beach – the urban footprint is still visible on the map but is lower than the southern beach areas.
- The northern population clusters visible on the map, over the Hawksbury River are the City of Gosford, with an estimated population of 171,992 (in 2014) and the Wyong Shire suburbs of Berkley Vale, Killarney Vale and Long Jetty-Blue Bay, which hug Tuggerah Lake with a population of around 49,500 (density of approximately 2,160 persons per km2).
Factors which affect population density are physical and anthropogenic; Physical limitations which may increase/decrease or direct certain patterns of population density include geography/topography constraints, climate and accessibility to resources and services/remoteness. Anthropogenic/human factors include political stability – people desire to live in an area which provides security and the ability to prosper, socioeconomic benefits and pull factors – such as cities and parts of cities which provide employment and education opportunities, as well as general attractiveness and desire to live in a city or certain parts of a city due to what it has to offer.
This series of blog articles explored the population density of Australian capital cities and analysed what it is that dictates the population density distributions in these cities. As a population forecaster, I see population density analysis as an important way of maintaining or increasing living standards which currently make many cities in Australia quality places to live in for existing residents and a desirable destination for migrants from within Australia and from abroad.
Nenad - demographic consultant
Nenad’s background is in geosciences and geographic information systems. At .id, Nenad has experience as both as a demographer and population forecaster. His areas of expertise are place-based analysis, identifying spatial patterns in demographic trends, community profiling, catchment analysis and an understanding of role and function of different communities.