What do the 2013/2014 economic datasets tell us?
We have recently fully updated all economy.id sites with 2013/14 datasets from NIEIR.
One of the great things about economy.id is that we have a fantastic data source for regular, small area economic information, which takes account of local changes in the economy, in the years in-between Censuses.
Census data underpins the model (which is just one reason we still need a Census every 5 years!), but it is updated every year based on new national datasets from the ATO and ABS Labour Force Survey.
For 2013/14, the National Institute for Economic and Industry Research (NIEIR) have rebased all the economy numbers to new $ terms, and also instituted some refinements to the model. For instance, you’ll now see a bit more local nuance in the Mining and Manufacturing sectors – ie. the data includes more information about how local areas differ based on their industry breakdown.
All modelled datasets (which sit mainly in economy.id under the Size, Structure, Industry Focus sections – but always check the source info on the page) are now expressed in $ 2012-13 dollar terms, so all the earlier years have been adjusted to this format.
Key stories this updated dataset tells:
- Australia’s total economic productivity (GDP) is just under $1.4 trillion in 2013/14, up from $1.36 trillion a year before.
- Ownership of dwellings in this country is worth about $131 billion, or about 10% of our total economy (this is the value of rents and the time value of owner occupied housing)
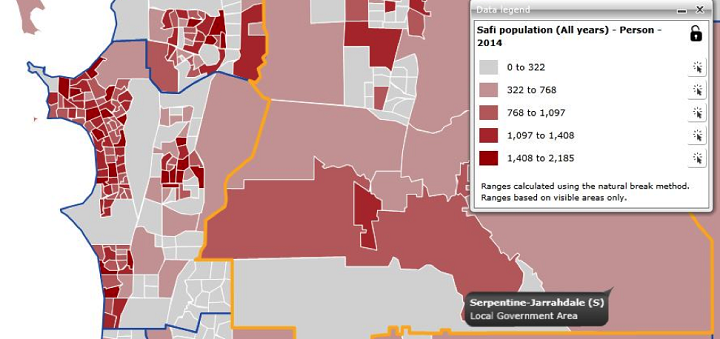
- Growth in most Western Australian LGAs has tapered off from the spectacular growth seen in recent years – but apart from mining areas, they are still growing.
- After years of modest economic growth, NSW LGAs are growing strongly again.
- Health Care and Social Assistance is now firmly entrenched as Australia’s largest industry, with just over 1.3 million workers. On a full-time employment (FTE) basis, however, this drops back to 976,000 jobs, and is closely followed by Construction, Manufacturing and Retail.
In addition, we have now standardised the benchmarks in economy.id. All metropolitan councils will now have a benchmark to the “Greater Capital City” region, while all regional areas will now have a benchmark to the “Regional part of state”, which is the rest of the state after the Capital City is removed. You may have other benchmarks as well, but we have done away with the old “Statistical Division” benchmarks from the site. These are no longer used by the ABS and now no longer used by .id. Greater Capital Cities are generally seen as a better measure of the workforce catchment of the capitals, so fit better with the economic profile.
We are continuing to add value to economy.id, with these regular annual updates, and new features for all our existing and new clients. We have also recently added some housing data which you can find out more here.
Glenn - The Census Expert
Glenn is our resident Census expert. After ten years working at the ABS, Glenn's deep knowledge of the Census has been a crucial input in the development of our community profiles. These tools help everyday people uncover the rich and important stories about our communities that are often hidden deep in the Census data. Glenn is also our most prolific blogger - if you're reading this, you've just finished reading one of his blogs. Take a quick look at the front page of our blog and you'll no doubt find more of Glenn's latest work. As a client manager, Glenn travels the country giving sought-after briefings to councils and communities (these are also great opportunities for Glenn to tend to his rankings in Geolocation games such as Munzee and Geocaching).