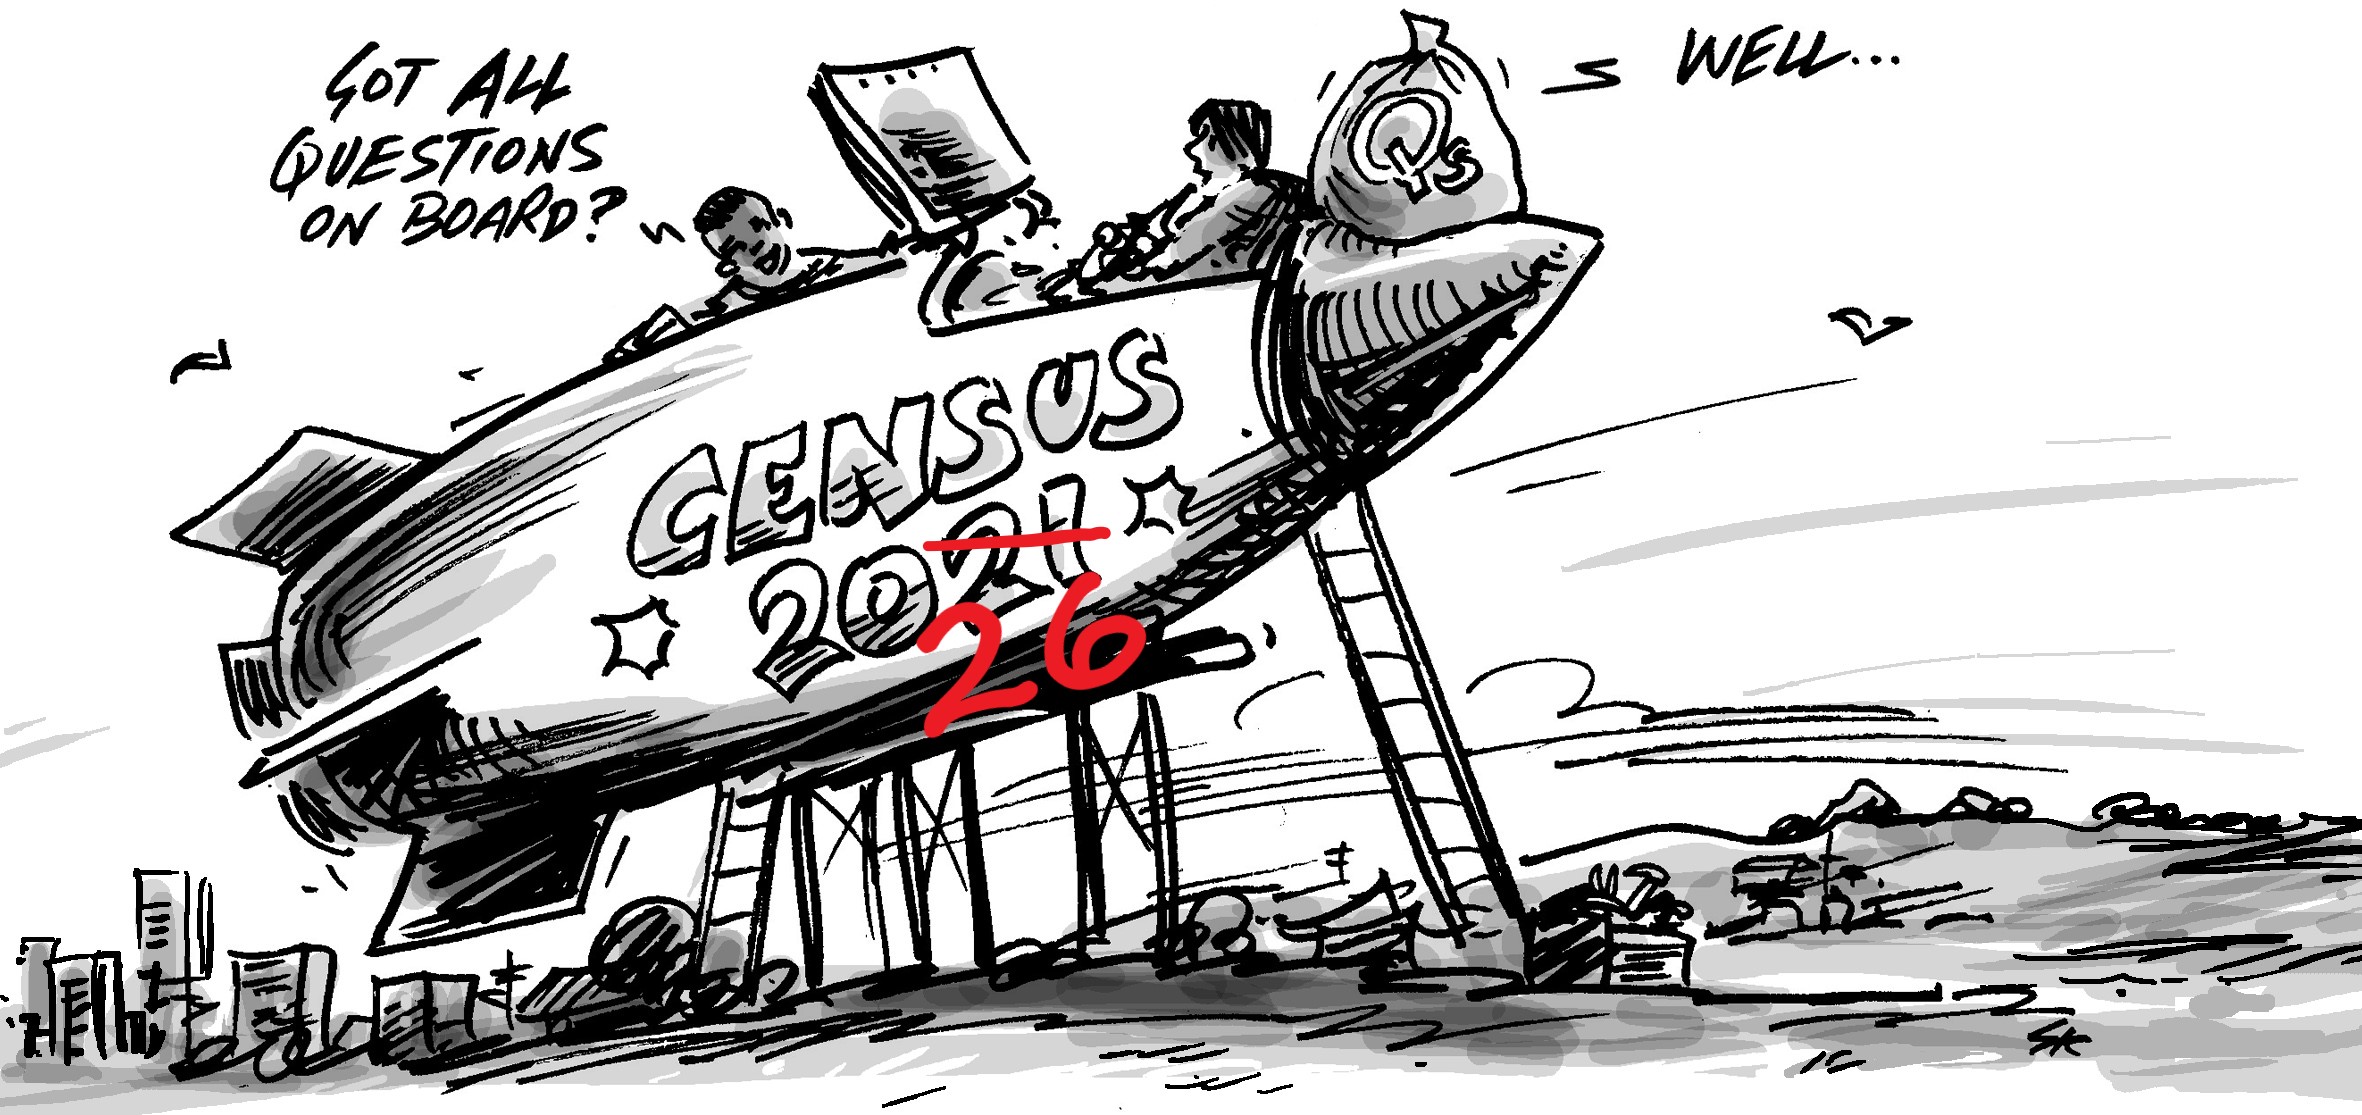
The first release of Australian 2011 Census results was published today. We celebrated with champagne and then crowded around computers as the results were released. Here is a quick summary of some of the headline numbers that caught our attention and busted a few myths. We’ll be exploring each of these in more detail over the coming days and weeks as we continue to pore over the figures…

How many are we?
- Growth is slower than estimated. 21,507,718 Australian usual residents counted in 2011 – this is almost 300,000 lower than the previous official estimates. This has a huge impact on all sorts of other assumptions that people have made about the population – such as average household sizes, people living in crowded group households etc
- WA (14.3%) and Qld (11.0%) were the fastest growing states – no surprises there.
- Nine of the top 10 fastest growing local government areas (of those with over 1,000 people) were in Western Australia, and 17 of the top 20. The other one was Wyndham in Melbourne.
- There was a 20.5% increase in the population identifying as Aboriginal & Torres Strait Islander, the largest increase in 40 years (since the 1971 Census which was the first to officially record them.)
How old are we?
Which age groups are growing faster than the average growth rate of the population?
- Infants (0-4 year olds) – proof that there is a baby blip in progress. Up by 160,000 – the largest increase of any group under 55.
- Young adults (20-34 year olds) – proof that the immigration policy was successful in bringing in young migrants (to replace the retiring baby boomers)
- Baby boomers (55-74 year olds) – as expected
- Frail aged (85+) – due to increases in life expectancy
Where were we born?
- Growth in the Australian born population= 6.7%
- Growth in the overseas born population = 19.9%
- The UK is still holding the top spot in terms of number of overseas born at 1.1 million. Compare this to the next largest – NZ at 483,398. China comes in third at 318,969 just pipping India at the post with 295,362. This looks like changing because the Indian population is growing twice as fast as the Chinese pop.
- Top five fastest growing overseas countries of birth (among those which are part of the standard ABS output) = India (100%), China (54%), Thailand (49%), Iraq (48%) and Philippines (42.1%)
- Greatest loss in overseas born = Southern Eastern Europe, Greece, Italy, Poland, Malta, Croatia. Will some of this reverse as the fallout from Europe leads to a new wave of economic migration?
- 11% of our Kiwi neighbours are living in Australia (more than the population of Wellington).
- Perception that Anglo-based migration is over is simply not true. 6% net increase in UK migrants (so more than replacing themselves as older migrants pass away) Ireland 34% (economic migrants?), South Africa 30%, New Zealand 24%.
How religious are we?
- One of the fastest growing religions was “No Religion”, up by 29%, to 22.3% of the population.
- Hinduism up 86% in line with growth in the Indian population
- Islam up 39.9%
- Christianity total up 3.7%. Much of this increase is in the “Christian not further defined” category.
What is our marital status?
- The registered married population fell below 50% for the first time (49.2%)
- Defacto and not married both increased at a faster rate than general population growth.
What type of households are we forming?
- Couple families without children increased at a faster rate than couples with children, as could be expected in an ageing population.
- Contrary to expectations average household size has remained stable (2.55 persons per dwelling in 2006 and 2011). This can be explained by the population growth being lower than expected.
- There has been an increase in group households (14.3%) but the average household size in group household has increased only slightly from 2.39 to 2.41. In fact it increased more between 2001 and 2006 – so no evidence that we are squeezing large numbers of people into group households.
What type of dwellings are we living in?
- Total dwelling stock in Australia increased by 693,505 to over 9.14 million dwellings (8% growth)
- High density dwellings increased at a rate of 14.7% and medium density grew 9.3%
- Separate dwellings lost ground, growing by only 7.5%. However that is still a massive increase of 469,149 houses compared to 220,154 increase in high and medium density combined. The growth rates of high and medium density will need to outstrip the rate of separate dwelling growth by a far greater amount if we are to achieve a significant changing in the dwelling mix.
What of home ownership – that great Australian dream?
- Despite all the talk of home ownership eluding the average Australian, there was actual little change in the proportions of people owning, buying or renting their dwellings. The proportion of fully owned homes fell by 1.59% but the proportion of those under mortgage increased by 1.06%. Combined, this is a reduction in home ownership of only 0.53%. Between 2001 and 2006 the reduction was greater at 1.4% – casting doubt on the belief that Australians have been priced out of their home ownership aspirations in large numbers.
- The proportion of dwellings that are rented did increase by 1.54% and interestingly the amount of public housing increased by 10,568 dwellings – not supporting the view that State Governments are pulling out of housing provision.
So these are our initial discoveries. We’ll be doing more in depth analysis over the coming weeks, so if you’d like to be kept in the loop with how Australia has changed, subscribe to our blog in the side panel.


