Are empty nesters moving to inner city apartments? - update
In 2011, I wrote about inner city high density housing, and the idea that empty nesters were moving in there. The article concluded that while there were a few empty nesters downsizing into inner city tower blocks, overwhelmingly these areas are occupied by the young, with no strong trend of over 65s moving into high density. That was based on 2006 Census data so I thought it was worth a look to see whether the situation had changed for 2011.

In 2011, there were 3,012,158 people in Australia (14% of the population) aged 65+, an increase of 367,782 people, or 13.9% since 2006. Conventional wisdom says that empty nesters downsize into smaller accommodations when they reach retirement age, and that there is a growing trend of ditching the family home for a swish inner city apartment and living the high life. But how realistic is this view?
In Census, .id looks at 3 main types of housing, which is occupied by people of different ages to varying degrees:
Separate houses: Your basic detached house separated from its neighbours – may be on a large or small block. Most dwellings in the outer suburbs and many country towns are these, and they make up 74% of all Australian housing, and house 80% of the population. Separate dwellings house 78% of people aged 65+ (of those not in aged care). So this is only marginally lower than the percentage of total population they house – not much evidence of downsizing there!
Medium density: This includes a whole lot of different types of housing – semi-detached, terrace houses, villa units, and small (1-2 storey max) blocks of flats. It is the main housing type in our inner suburbs, some suburban areas particularly around transport nodes, and the centres of some country towns. Medium density houses 13% of the total population but 16.2% of those aged 65+ so there is some evidence of downsizing here – most retirement villages would fall into the medium density category so that could explain the difference.
High density: Includes all flats/apartments in 3 or more storey blocks. This is common mainly in inner city areas, harbourside and some suburban centres in Sydney, and the Gold Coast. High density houses 5.6% of our population but only 4.1% of those aged 65+. Even among the general population, the much publicised move to higher density living seems like a very minor trend, with only 1 in 20 living in this form of accommodation nationwide at 2011.
The remaining 2% of population live in “Other dwellings” including caravans and flats attached to houses (including granny flats).
But the type of accommodation you live in is highly dependent on age, and high density is very popular among the young.
This chart shows the percentage of population by age who live in medium density accommodation. It overlays 2006 and 2011 so we can see the changes.
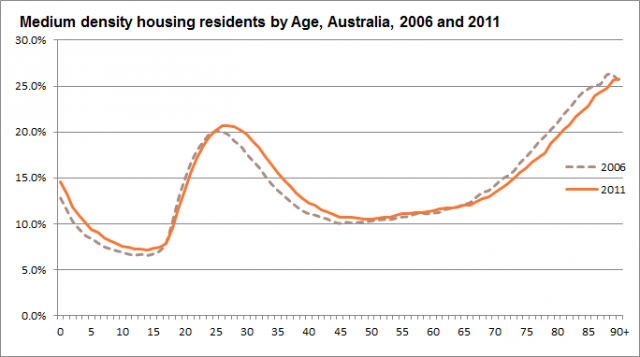
The main change is that there really isn’t much change. The elderly still do downsize into medium density and there is also a bit of a peak among the young, but even at 90+, only 25% of the population outside care are living in medium density housing. The main change over 5 years seems to be that everyone has aged a bit. More people are having kids in medium density, but the young people have stayed put and are just getting a bit older, and so are the elderly – with slightly less in each age group living in medium density as they move along the age groups.
This is the same chart for high density (remember that’s most of the inner city accommodation empty nesters are supposed to be downsizing to).
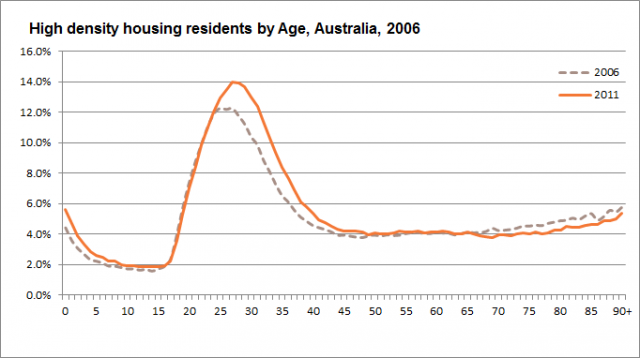
With a substantial growth among the population in their 20s and early 30s nationwide, there has been a significant spike in this group, who are now more likely to live in high density housing (still only peaking around 14% at age 27 though). Populations around retirement age live in higher density to about the same extent as in 2006, while those aged 70+ are actually less likely to live in high density than they were 5 years before.
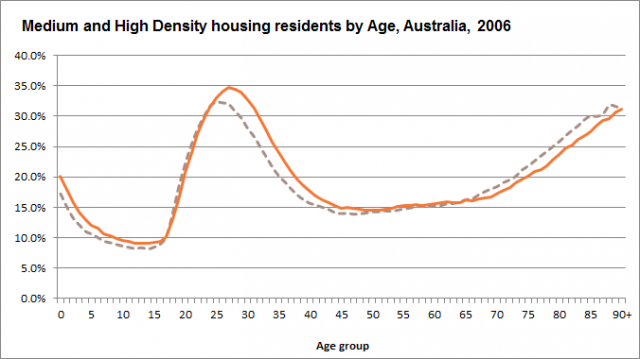
This chart shows the combined rate of medium and high density housing by age. As you can see, even at 90+, the propensity to live in a unit or flat of any sort is still lower than it is for 30 year olds, and while the proportion of young adults and young children living in high density is on the increase, the proportion of elderly living there is declining!
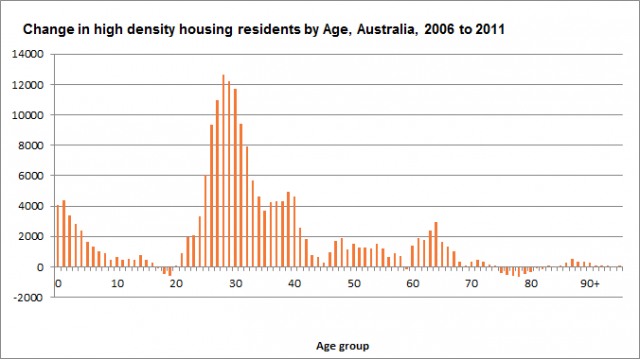
This final chart is the most interesting, and shows the numerical increase or decrease in each single year of age, living in high density housing (only high density this time) over 5 years. There is a really clear trend towards young families moving into these places, but no trend towards the elderly – there is a small spike among people in their early 60s which could be the trend alluded to by the myth, but when you look at it against the large population increase in this group (the early baby boomers), it’s pretty minor.
Of course there are exceptions to every rule, and there are a few pockets of high density housing which do attract somewhat older residents. Notably Docklands in Melbourne and Elizabeth Bay in Sydney. But even these areas are only older compared to their inner city surrounds, they are still young compared to the nation.
Access the Australian Community Profile now! You will find Census results for each Capital City, State, Southeast Queensland and Australia on topics including population, age, country of birth, languages spoken, occupations, industries, employment, disability, income, qualifications, transport and much more…
Access the new profile.id sites and other population statistics for Local Government Areas and suburbs at .id’s demographic resource centre.
![]()
Glenn - The Census Expert
Glenn is our resident Census expert. After ten years working at the ABS, Glenn's deep knowledge of the Census has been a crucial input in the development of our community profiles. These tools help everyday people uncover the rich and important stories about our communities that are often hidden deep in the Census data. Glenn is also our most prolific blogger - if you're reading this, you've just finished reading one of his blogs. Take a quick look at the front page of our blog and you'll no doubt find more of Glenn's latest work. As a client manager, Glenn travels the country giving sought-after briefings to councils and communities (these are also great opportunities for Glenn to tend to his rankings in Geolocation games such as Munzee and Geocaching).