Census 2011 – our ever changing age structure
How old are you? Some would consider this a personal question but there’s no getting away from the fact that our age is part of who we are. The age structure of a population is an important determinant as to services demanded, policies implemented and consumer behaviour. This blog will examine how Australia’s age structure has changed over the last three Censuses and what this might mean…
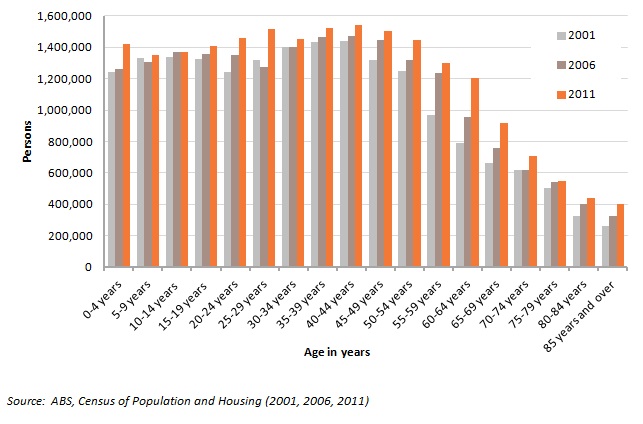
The graph below shows the age structure of the Australian population for the 2001, 2006 and 2011 Censuses based on place of usual residence. Clearly, there have been some significant changes, particularly in the 0-4, 25-29 and 60-64 year cohorts. These changes are associated with various demographic processes that, on the whole, have been evident for some time.
The main points are summarised here –
Growth in ALL age-groups
All age cohorts recorded growth between 2006 and 2011. Most growth, as measured by an increase in numbers was recorded for 60-64 year olds (248,039 – 25.9%) and 25-29 year olds (236,306 – 18.5%). Interesting to note the number of young adults almost replacing the retiring baby boomers.
Big increase in young adults thanks to migration
The large growth in the 25-29 year old cohort was not unexpected, but was somewhat remarkable given that this cohort declined in size between 2001 and 2006. The large increase recorded in the last intercensal period is clearly related to record levels of net overseas migration in the 2008-09 period in particular (most migrants, including Australians returning home after extended periods overseas, tend to be young adults)
Baby boomers start to reach retirement age
The increase in the 60-64 year olds is related to the baby boomer generation moving through the age spectrum. In 2011, this cohort was born roughly between 1947 and 1951, ie the immediate post-war period when fertility rates started to increase. There are 1.21 million persons in this age cohort. Following this cohort back in time you can see their impact on the age structure – between 2001 and 2006 they were aged 55-59 and were the cohort with the highest intercensal growth in that period. No doubt they will have a similar impact as they continue to age, though over time mortality will start to have an effect.
Despite the attention given to baby boomers, it’s interesting to note that the largest age cohort in Australia are 40-44 year olds, totalling some 1.54 million, or 7.2% of the population. This was followed by 35-39 year olds (1.52 million) and 25-29 year olds (1.51 million).
More children
Another trend apparent in the graph is the large growth of 0-4 year olds. This cohort recorded growth of 160,650 (12.7%) between 2006 and 2011, compared to just 16,430 between 2001 and 2006. Much of this is due to increases in the fertility rate in the last 5 years or so (see this blog for more information). The size of this cohort was 1.42 million and is larger than 5-9 year olds (1.35 million) and 10-14 year olds (1.37 million). Clearly, as these 0-4 year olds age they will make greater demands on the education system than their older playmates.
People living longer
Persons aged 85 years and older grew by 24.7% (79,830 persons) between 2006 and 2011, almost pipping the growth rate recorded by 60-64 year olds. There are now 402,690 persons aged 85 years and over in Australia, compared to 262,690 in 2001 and 322,860 in 2006. At this end of the age spectrum, there is a clear difference between males and females. Roughly one-third are males and two-thirds are females, though the difference has lessened slightly over time due to increasing life expectancy of males at older ages.
But not that much longer…
Continuing on the age theme, and to highlight a quirky statistic , it was interesting to note there was a decline in the number of 100 plus year old males between 2006 and 2011, from 802 to 657. Though these numbers are small, it does fly in the face of previous trends and makes you wonder – is this a quirk of statistics, or a reduction in Census vandalism?? I’m sure the ABS has procedures to ensure it’s not the latter!
Because the age structure of a population is a critical indicator of the demand for services, particularly for our local government clients, future Census blogs will look more closely at some of these cohorts, particularly with respect to spatial patterns and changes over time. Stayed tuned!
Have you noticed any changes in your local area? Are there more children running around, are the pre-schools filled up? Can your elderly relatives find places in local nursing homes? Drop us a line and tell us your story to help us build narratives around local population change.
To follow .id’s analysis of the 2011 Census results as they are released, sign up for email or twitter notifications in the sidebar.
![]()
Simone - Myth Buster
Simone has a rich background in human geography, demography and urban planning – a background that was useful in her previous roles in the Commonwealth and State Governments, and now as part of the forecast team at .id. From the Queensland coast to the southern suburbs of Perth, Simone produces population and dwelling forecasts that help local governments make informed decisions about future service and planning needs. She is a regular contributor to .id’s blog and has spoken at several conferences on how our cities and regions are changing. She is a big advocate of evidence-based planning and how Census and other data can inform this. Outside of work Simone is a keen traveller and photographer – interests that tie in well with her professional life and help her to understand “place”.


