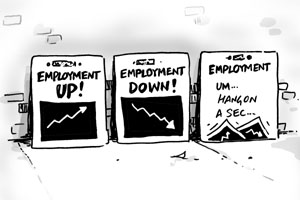
Missing millions – the problem with using Census data for employment estimates
Recently, I have been asked a lot about why ABS Census employment estimates are different to other sources like the ABS Labour Force and NIEIR’s LGA employment estimates. In this blog, I thought i’d share some insights about:
- The problems with using Census data for LGA employment estimates
- .id’s solution for measuring economic and employment activity at the LGA level
- Which data source to use
- Upcoming release of the NIEIR State of the Regions dataset for all LGAs – this will be a great resource for understanding an LGA’s post-Census position and ongoing recovery from COVID-19. Register for updates about the State of the Regions dataset here.
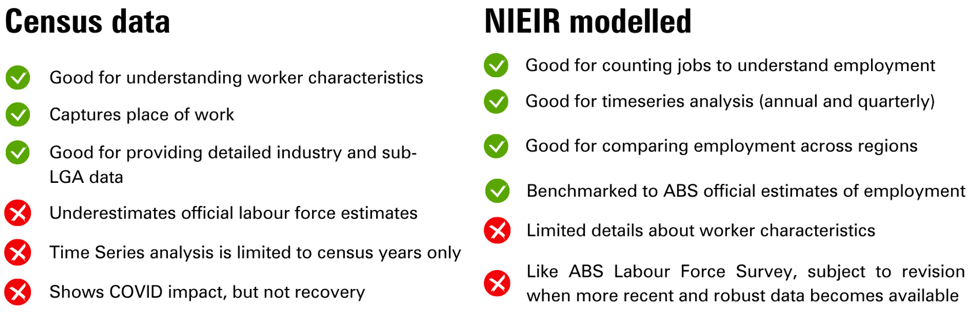
The Census is a fantastic resource for all aspects of population characteristics. It also allows for the analysis of labour market activities and industry and occupation data at a small area level. This provides a rich snapshot about worker characteristics like hours worked, income, age structure, occupation by industry and field of qualifications by industry.
Unfortunately, when it comes to giving an accurate picture of the number of jobs at the LGA level and how they are changing, broken down at industry level, Census is not the right tool. This is not to say the Census isn’t useful – it’s still a brilliant resource for understanding the characteristics of employed people, which is why we publish a range of cross-tabulations in .id’s economic profile tool, economy.id. However as a measure of total employment and change over time, it’s a little limited.
The problem with using Census data for employment estimates
When using and interpreting Census employment data there are several things to be aware of:
- The missing millions: ABS Census undercounts the official employment estimate by around 15% (that’s 2.0 million people).
- Skews the relative importance of industries: The undercount can vary between industries. This can misrepresent the underlying structure of the economy because some industries have a higher undercount than others.
- Patterns, trends and outliers can go unnoticed: ABS Census only provides a snapshot of change over time and does not provide a continuous and regular time series to help monitor labour force conditions. Also, movements between census periods may be due to different undercounts rather than underlying changes in the local economy.
- The impact of COVID-19: ABS Census employment estimates were impacted by the COVID-19 pandemic and change between Census periods may not be an accurate reflection of industry performance. Careful analysis is required to identify trends vs COVID-19 impacts.
The missing millions
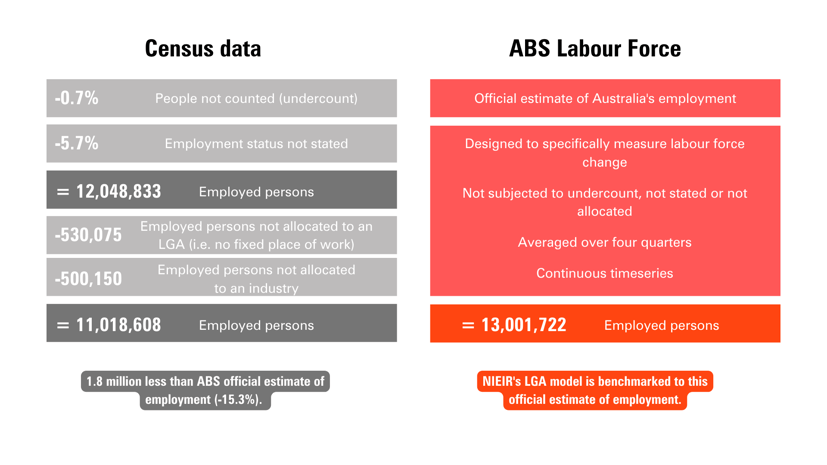
The diagram below shows the deficiencies in using the Census data for workforce estimates Australia-wide. It includes the number of people in the 2021 Census who were employed and could be accurately coded to an LGA and industry, and how NIEIR and the ABS Labour Force Survey estimates of employment (a survey which is undertaken monthly and helps to monitor job change in the economy) differ from this in terms of total numbers.
Census data undercounts the official employment estimate because it omits people who:
- didn’t fill in the census form
- don’t state whether they are employed
At the LGA level, even more are unallocated due to no fixed place of work. Industry estimates are also subjected to an undercount due to people who don’t state their industry.
This means on average, local employment at the LGA and industry level is undercounted by around 15%.
Skews the relative importance of industries
When you start breaking this down by different industry sectors, the story gets more complex. For some industries the undercount is worse. When the undercount in one industry is more marked than others it can skew the relative importance of different industries in an area.
This table shows the census count by industry compared to the ABS labour force estimate by industry.
So there is a need to make some adjustments to get a better estimate of the actual number of workers in any industry in any LGA and how this changes over time.
Patterns, trends and outliers can go unnoticed
While Census is a great source of employment information for small areas, allowing for analysis at the detailed industry or occupation level, it is only produced on a five yearly basis, so is not a great source for monitoring of labour market performance overtime. This means any structural changes in the economy can go unmeasured, significant job gains or losses can go unnoticed, and outliers like COVID-19 can mask trends and turning points.
For example, the 2021 Census data shows that Accommodation and Food Services employment in Greater Sydney increased between 2011 and 2016 but then fell sharply in 2021 due to COVID-19 pandemic. But what was the trend prior to COVID-19? Has employment in Accommodation and Food Services recovered since August 2021? What impact are economic development actions having on the local recovery?
To answer these questions, we need a continuous timeseries data source like the ABS Labour Force Survey. This makes it easier to visualise and identify patterns, trends and outliers. As we see in the chart below, employment in Greater Sydney’s Accommodation and Food Services grew strongly between 2016 and 2019, was hit hard by COVID-19 through 2020 and 2021 and started to recover in early 2022. Greater Sydney Accommodation and Food Services employment was still 9% below the pre-covid19 level (February 2020) in November 2022. Armed with this information, an economic development professional can make much more informed decisions about their recovery activities.
The issue for economic development professionals is that the ABS Labour Force Survey produces statistics based on where people live, not where they work. Understanding where people work is critical for anyone wanting to measure economic development activity at the LGA level.
What is the solution?
The best source of underlying data local employment by industry by place of work is still the census. The number of jobs Australia wide is known. Over eighty-five percent of them are accurately coded to an LGA. BUT the missing 15 percent needs to be allocated to the right LGAs and the right industries within those LGAs. This requires specialist modelling techniques based on alternative data sources and a passion for understanding local economies.
.id are experts in Census data, so we understand its shortcomings. We also know that creating local employment is one of the most important objectives of economic development, so measuring it accurately and frequently is paramount.
To address this challenge, we selected NIEIR (National Economics), well known to local government from The State of the Regions reports they produced for ALGA and there economic modelling undertaken at all levels of government. NIEIR undertake micro simulation modelling with a range of data inputs to allocate the missing 15 percent of jobs to an LGA to address the issues around the missing millions, industry skew and trend analysis. These data sources include the monthly Labour Force Survey by ABS (which doesn’t suffer from undercount issues, as questions are asked of respondents by trained interviewers), Centrelink estimates of employed and unemployed population, and Tax office counts of employment by industry which are based on actual tax returns.
Using these data sources provides the added bonus of being quarterly updated too, so you don’t have to wait for 5 years to understand the recovery of your local economy.
It’s not perfect. It is still only a model of reality. But it is much better than just accepting the undercount. And it provides local government with an opportunity to add their local knowledge to the model.
Tips on which data source to use
- If you need to know the total employment in a particular industry, use the NIEIR estimated total employment.
- If you need to know the employment change by industry, use the NIEIR estimated total employment.
- If you need to compare the demographic characteristics of the workers in different industries, or breakdown to very detailed industry subgroupings, use Census counts of employment.
- If you need to compare resident employed to those who commute out, use Census counts of employment (journey to work).
All these options are available in .id’s economic profiles (economy.id). When you’re in a topic, the table clearly shows whether you’re viewing Census or modelled data.
Consultant tip: Use multiple datasets to inform your decisions. When our economic experts undertake an economic analysis of a region, they use a range of data sources in addition to ABS Census data to help understand local economic performance and help inject confidence into decision making.
Release of NIEIR State of the Regions Data
In the first half of 2023, the NIEIR economic model will be updated to reflect the latest estimated resident population (ERP) and Labour force population based on the 2021 Census. This will affect all economy id subscribers. It is a regular 5-yearly rebasing process which follows each Census, and ensures the NIEIR model estimates are benchmarked to the most recent official population and labour force information. This process will result in revisions to NIEIR (and ABS Labour Force) estimates going back to 2016.
This release will give you the most complete, nuanced, up to date view of local economies across Australia, which means you will be able to identify your post-Census position and ongoing recovery from COVID-19. We are excited about this release and our team will be hitting the road to share the results with you.
Register here for regular updates about the upcoming release of the 2021/22 State of the Regions dataset.
In the meantime, if you need any help or support when gathering an evidence base please don’t hesitate to reach out to one of our friendly team.
Rob Hall
Rob is driven by a desire to help shape communities for a better future. Trained as an economist, he has a unique twenty-year background in economics, demographics, statistics and strategic planning with a focus on understanding how economic forces influences local government areas across Australia. At .id, Rob provides Local Government with high-quality analysis and information tools, including specialised consulting services and tailored information products such as economy.id.