How ‘liveable’ is Australia? Investing in what’s important to advance quality of life
Liveability is a personal and subjective concept. It is reflective of an individual’s unique values and experiences of a place. Decision makers wanting to advance quality of life need to place resident’s values and experiences at the centre of understanding liveability. The 2023 National Liveability Survey* was recently conducted to explore the values, experiences and future needs of Australians. The results highlight barriers to, and opportunities for, improving the liveability of Australia. This data is principally used as spatial benchmarking for councils and other organisations who subscribe to our Living in Place community survey.
This is the first article in a series exploring the 2023 National Liveability Survey data. It looks at:
- Overall liveability for Australia
- Liveability for Metropolitan Australians
- Liveability for Regional & Rural Australians
Future articles will look in more detail at liveability in relation to:
- Housing
- Health and Wellbeing (coming soon)
- Living in the Inner City, Middle and Outer Suburbs (coming soon)
- Age (coming soon)
How “liveable” is Australia?
In the 2023 National Liveability Survey Australia scored an Overall Liveability Index (OLI) of 62.6 out of 100. This was consistent with the 2022 result (62.5).
The OLI is calculated using two inputs:
- Community Values = what attributes respondents believe make somewhere a good place to live.
- Community Experiences = how well respondents feel the attributes are being delivered/experienced in their local community.
There are 16 liveability attributes used to measure values and experiences. These include factors like “Feeling safe“, “Social cohesion“, “Good job prospects“, “Making your way to and from services such as healthcare, education and employment with relative ease“, “High quality health services” and more.
The liveability indices varied between and within metropolitan and regional areas. Metropolitan liveability ranged from 53.1 in Darwin through to 71.6 in Adelaide. Regional & Rural liveability landed between 51.5 in Regional NT and 67.6 in Western Victoria.
Does this mean Adelaide is a better place to live than Darwin? And that Darwin is more liveable than Regional NT?
To a certain degree, yes.
But because the Index is calculated by multiplying ‘local community values’ with ‘local community experiences’, it reflects what is unique about a community at a point-in-time. So while comparing one region against another is interesting, and provides us with a sense of relativity, it is not overly instructive and doesn’t unlock the true value of this approach.
The significance of the local area liveability indices is in revealing what a particular community believes needs to happen to advance their quality of life, where they live. See which councils are using this approach to understand and advance quality of life for their residents. The balance of this article explores the community’s views on liveability at very large geographies – Australia overall, Metropolitan Australia, and Regional & Rural Australia.
Overall Liveability in Australia
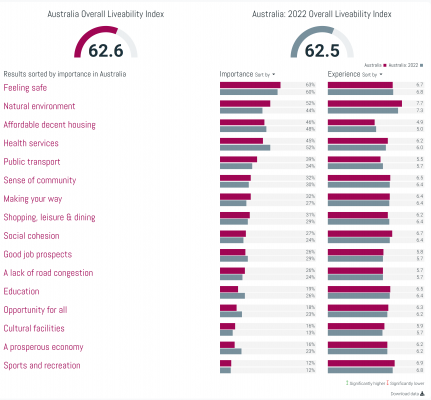
The most important factor influencing liveability for Australians was “Feeling safe”. Local experiences of safety were also rated positively. Likewise, Australians value “Access to the natural environment” as a key influence on their quality of life. It had the highest experience rating across all the liveability attributes (7.7 out of a possible 10).
“Affordable decent housing” was the third most important liveability attribute for Australians. But it received the lowest experience rating across all the attributes. This combination of very high value and very poor local area experiences tells us that the provision of “Affordable decent housing” represents the single biggest inhibitor to advancing quality of life across Australia. The second article in this series will explore community views on housing and implications for decision makers in more detail.
Overall Liveability in Metropolitan Australia
Overall liveability in Metropolitan Australia (64.0) was slightly higher than the national average (62.6). There was a clear message in the survey data that investment in transport infrastructure and public transport services will be critical to advancing living standards in metropolitan areas. Investment in transport infrastructure enables people and goods to move around, contributing to:
- Increased economic activity
- Improved productivity
- Jobs growth
- Improved access to work, education and social opportunities
- Reduced travel time, congestion, accidents and stress.
Combined, place based efforts to improve local area experiences regarding “A lack of road congestion“, the provision of “Reliable and efficient public transport services” and how residents feel about their ability to “Make their way to and from services such as healthcare, education and employment with relative ease” will, over-time, improve the community’s views regarding their day-to-day mobility. And this improves overall quality of life.
But the impact of improved transport infrastructure and services has an echo effect. Efficient and accessible transport options are also crucial for the provision of “Affordable decent housing“. These survey insights tell us that the provision of “Reliable and efficient public transport” is an absolute and relative strength of Inner City and Inner-Middle LGAs. Public transport is important to these communities, and is experienced relatively well in these areas. Given this, it makes sense to look at how the nation’s patchwork of inner and middle suburban areas that have objectively strong transport infrastructure where service capacity can meet the needs of increased population volumes can be more easily considered for medium and high-density housing.
Take a look at how the City of Parramatta is using Living in Place data to understand the important role that improved transport infrastructure and services would play in advancing their residents’ quality of life.
Overall Liveability in Regional and Rural Australia
Overall liveability in regional and rural regions (61.2) was slightly lower than the national average (62.6). The provision of “High quality health services” is key to improving quality of life for Australians in Regional & Rural areas.
People living in rural and remote areas of Australia are typically older, have lower life expectancy and higher rates of disease and injury than those living in metropolitan regions. And they report less positive experiences with accessing “High quality health services”.
Regional and rural areas face unique challenges in delivering health services, like:
- Longer travel distances to specialist services
- Lower levels of health literacy
- Higher rates of risky health behaviours like smoking and alcohol abuse
- Attracting and retaining qualified health practitioners.
Positive experiences of health and wellbeing impacts people’s ability to take part in the economy and community. This can restrict access to opportunities that lead to a higher quality of life.
See how Sunshine Coast Regional Council is understanding their community’s health and wellbeing needs using Living in Place data.
Summary
The results of the 2023 National Liveability Survey tell us what factors are important to advancing the quality of life of Australians. Sustaining investments in community safety and access to our natural environment are crucial for maintaining standards of living. But the provision of affordable, decent housing poses the biggest obstacle (and opportunity) to increasing Australia’s liveability.
For metropolitan areas, there is a collective need to invest in improved transport infrastructure and public transport. But this needs to be done in consideration of how it will also boost access to “Affordable decent housing”. Overall liveability in regional and rural regions (61.2) was slightly lower than the national average (62.6). The provision of “High quality health services” is key to improving quality of life for Australians in Regional & Rural areas.
* The 2023 National Liveability Survey was conducted by the .id Community Views social research team in partnership with Ipsos Public Affairs. Access more information about the survey methodology here.
Dan Evans
Dan is a social researcher with more than 10 years’ experience investigating community attitudes to and experiences of planning and development, transport infrastructure, public health and a bunch of other things. Dan joined .id in April 2020 to design and deliver Living in Place – an independent, robust and repeatable community survey that seeks to understand and advance the liveability of Australians’ local areas.