Rebased population estimates – big changes to your LGA population
Revised yearly population estimates for LGAs from 2017 onwards have just been released by the ABS, based on the 2021 Census. Glenn explains how this revision process (rebasing) works and what it means for LGAs across Australia.
Stay up to date with the Census roll out.
It probably sounds like a bit of stats’ nerd speak, but the ABS has just released the “rebased” population estimates for LGAs and other smaller geographic areas. What this means – and why it’s important – is it updates actual population counts in light of the Census results.
Census, population estimates and rebasing explained
Every year, the ABS gives us a population estimate for every place in Australia, usually released in March, and taking into account births, deaths and an estimate of migration in and out from the previous year. We usually comment on these measures of population change, and it’s included in our community profile tool, under “Population estimates”.
What’s maybe a bit less well known is that these estimates are revised after the Census. In a Census release year we get two versions of the population estimates. One we got back in March, and that was based on continuing annual updates from the 2016 Census results. This week we have seen the second set, which is estimates based on the 2021 Census. This enables us to see how close the earlier estimates were to the best estimates using the latest Census data. For 2021 there are some major revisions. This is not saying the ABS “got it wrong”; it shows the importance of running a Census to adjust the population estimates, which are less reliable the further you get away from having done a Census.
It’s also worth re-emphasising that the Census counts themselves are not population estimates. These new figures become the official population estimates for each place, and have been revised for each year back to 2017 based on what the 2021 Census showed, but the actual Census counts are always adjusted to provide population estimates.
Where did the largest population estimate revisions occur?
We already know from the figures released on June 28th that Australia’s overall population was revised down by 50,063 people between the pre-Census and post-Census estimates. And both Victoria and New South Wales were revised downwards by about 100,000 each, while WA, SA, Tas and the ACT were all revised up.
This is how these revisions played out at a local level.
Largest upward revisions
| LGA and State |
2021 rebased population | Revision from previous 2021 estimate |
| Blacktown NSW | 399,711 | +12,607 |
| Stirling WA | 234,380 | +11,120 |
| Wyndham Vic | 296,193 | +6,622 |
| Canning WA | 99,351 | +5,740 |
| Camden NSW | 119,951 | +5,435 |
| Gosnells WA | 131,381 | +4,922 |
| Port Adelaide Enfield SA | 134,202 | +4,663 |
| Joondalup WA | 165,075 | +4,496 |
| Mackay Qld | 123,183 | +4,460 |
| Darwin NT | 85,397 | +4,460 |
| Toowoomba Qld | 175,316 | +4,181 |
| Mandurah WA | 93,414 | +3,966 |
| The Hills Shire NSW | 192,509 | +3,952 |
| Glenorchy Tas | 51,233 | +3,944 |
| Lake Macquarie NSW | 213,967 | +3,936 |
These are the largest changes in Australia where the population was revised upwards by the ABS. These are not growth figures, just the amount of revision to the previous estimate for the same year’s population. The largest is Blacktown City in Western Sydney, revised upwards by over 12,000, or 3% of their very large population. Many of the upwards revisions are in states like WA where the whole state’s population was revised upwards. But others, including Blacktown, are not. Even for Victoria, which had the largest downward revision as a state, has Wyndham in this list, revised up by over 6,000 people (2%).
Some of these represent a massive percentage revision. The City of Glenorchy, part of suburban Hobart, was revised upwards by almost 4,000 in a population of 47,000 – a revision of 8.3% of their total population, or equivalent to the last 15 years population growth in Glenorchy. Also just off the top list here are significant revisions upwards to Hobart and Launceston LGAs in Tas as well. The biggest percentage revision in that state is actually the Central Highlands LGA (centred on the tiny town of Bothwell), which was revised up 420 people – almost 20% of their population!
Largest downward revisions
| LGA and State | 2021 Population | Revision from previous 2021 estimate |
| Sydney NSW | 214,851 | -27,386 |
| Randwick NSW | 135,275 | -18,223 |
| Melbourne Vic | 153,674 | -16,186 |
| Inner West NSW | 183,772 | -15,987 |
| Darebin Vic | 150,335 | -12,166 |
| Moreland Vic | 173,541 | -11,166 |
| Gold Coast Qld | 633,764 | -9,697 |
| Port Phillip Vic | 103,508 | -8,584 |
| Brisbane Qld | 1,264,024 | -8,437 |
| Yarra Vic | 91,543 | -8,079 |
| Stonnington Vic | 106,278 | -8,062 |
| Northern Beaches NSW | 264,481 | -7,703 |
| Maribyrnong Vic | 86,398 | -7,069 |
| Boroondara Vic | 169,901 | -6,731 |
| Georges River NSW | 152,703 | -6,563 |
| Moonee Valley Vic | 122,965 | -6,414 |
The most significant downward revisions are entirely in Sydney and Melbourne, barring two in SE Queensland. Inner city Sydney and Melbourne LGAs themselves are the largest adjustments of all, with Sydney’s downward revision of more then 27,000 equating to a “loss” of over 10% of total population. Neighbouring Randwick is even more significant, at about 12% of total LGA population, with Melbourne not far behind. These are undoubtedly pandemic-related trends, and the absence of overseas students during COVID border closures had an immense effect on these inner city areas.
Though Sydney had the largest downward revision, more of the top negative movements are in suburban Melbourne; the declines are spread through the inner-middle suburbs in places like Moreland, Darebin, Yarra, Boroondara and Moonee Valley. These are student-affected but also broadly overseas-migration affected, with lots leaving during the pandemic. Areas of Sydney such as Georges River and Northern Beaches feature in the list, but it seems like the NSW population exodus was more concentrated in the inner city, while Melbourne was across the metro area (but still with strong growth in the outer suburbs).
The only two in this list outside NSW and Vic – Brisbane and Gold Coast LGAs – did have a downward revision, but these are the largest two LGAs in Australia, so as a percentage of population they were relatively small revisions.
Broader trends and updates
The general trend here is that the ABS underestimated the amount of growth in outer suburban growth areas and regional cities to a significant extent, while overestimating the amount of growth in inner suburban and inner-city areas, particularly in the big east coast cities. This may be because young people, who dominate our inner cities, are hard to catch in things like Medicare change-of-address records (one of the inputs to interim estimates). It may also be to do with using increasing dwelling numbers in the inner cities as a proxy for population growth, in a pandemic when many of the dwellings were left unoccupied (in the City of Melbourne, 1 in 4 dwellings were unoccupied on Census night).
These new estimates sweep away the past and become the new best estimates for local areas, lining up with the new Census data as well as feeding into important processes such as electoral redistributions (one of the main purposes of running the Census in the first place). Here at .id we’ll be updating the populations for the last 5 years in the community profile sites over the next few days, so you can have the correct numbers in there as soon as possible. We’ll send a product update through to subscribers when that’s done; sign up here if you want to get the update.
Getting it right in Bogan
Before I go, on a slightly more light-hearted note, not all areas were significantly revised. Many stayed about the same population after revision. There was only one LGA in Australia, however, which stayed exactly the same after revision: none other than Bogan Shire, NSW, centred on the town of Nyngan with a population of 2,481 and home to The Big Bogan. (I don’t think they counted him in the population, though.)
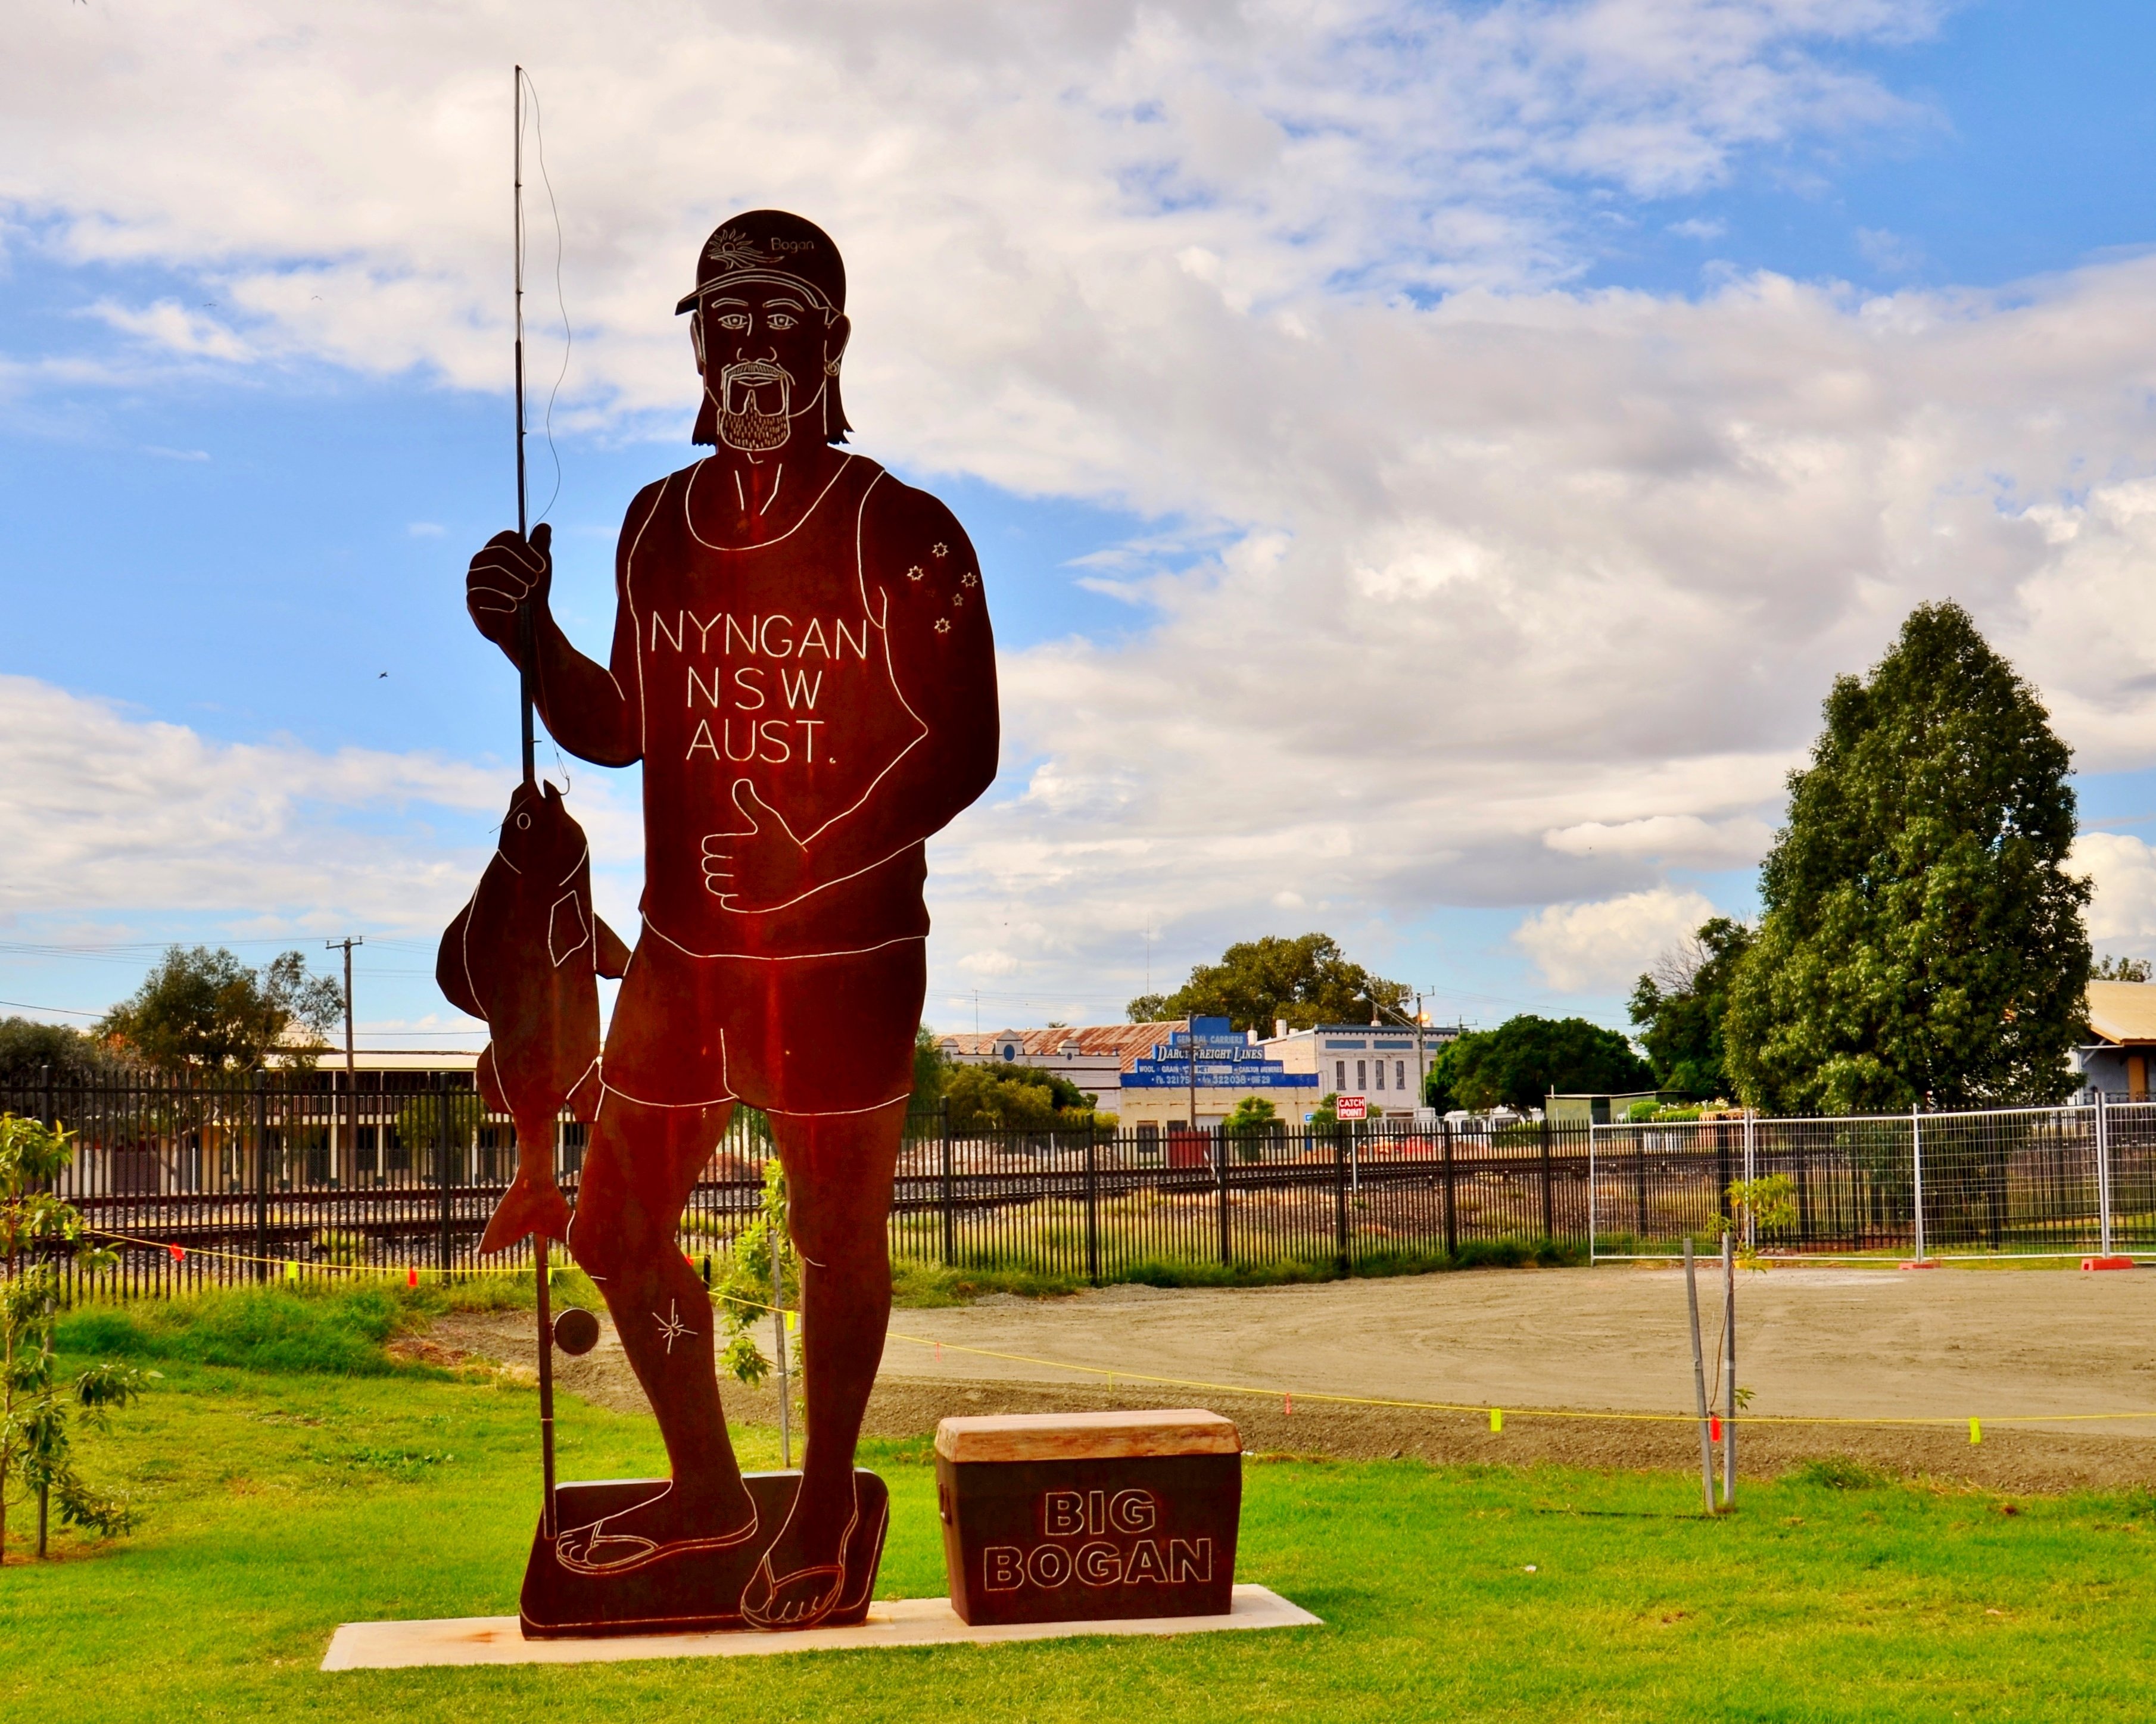
Bahnfrend, CC BY-SA 4.0, via Wikimedia Commons
Enjoy!
Glenn Capuano - Census Expert
Glenn is our resident Census expert. After ten years working at the ABS, Glenn's deep knowledge of the Census has been a crucial input in the development of our community profiles. These tools help everyday people uncover the rich and important stories about our communities that are often hidden deep in the Census data. Glenn is also our most prolific blogger - if you're reading this, you've just finished reading one of his blogs. Take a quick look at the front page of our blog and you'll no doubt find more of Glenn's latest work. As a client manager, Glenn travels the country giving sought-after briefings to councils and communities (these are also great opportunities for Glenn to tend to his rankings in Geolocation games such as Munzee and Geocaching).


