What’s happening to South Australia’s population?
How are COVID-19 restrictions impacting South Australia’s population growth? In today’s blog, Glenn looks at how the effects of the pandemic relate to South Australia compared to (the more talked about) New South Wales and Victoria.
South Australia is one of the Australian states (along with WA and Tasmania) who have been largely COVID free since the first lockdown in March–April 2020. Apart from a scare in November 2020 and the most recent one-week lockdown (ending as I write this), SA has been largely unscathed by the problems in NSW and Victoria. The state has had strong border controls for much of the past year and a half to keep the virus out. How does this affect the population story? We now have information on state and regional populations through to December 2020.
We know Australia’s population has been stable overall. Victoria saw a decrease in the second half of last year, but in South Australia it’s almost business as usual. Never a rapidly growing state, SA’s population continues to grow slowly, even with borders closed, and it’s turned around interstate migration, with more people now moving in. Let’s take a closer look.
International migration is declining
As at 31 December 2020, South Australia’s population stood at 1,770,790 people, an increase of 9,400 from the previous year (0.5%), but up by just 300 in the last half of the year. Like most parts of Australia, the closure of borders has had an impact here. SA has typically added around 12,000 to 15,000 people p.a. from overseas, and the last 6 months lost 2,200 in net terms. Contrast this to Victoria, however, which lost over 38,000 overseas migrants in that time.
Here is the annual chart for SA’s overseas migration since 1972:
An older population means lower "natural increase"
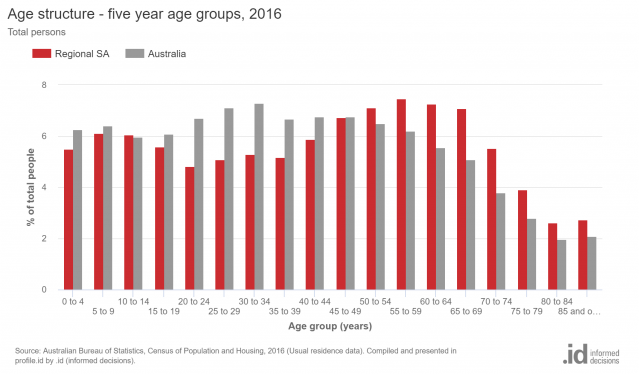
South Australia has an older population than other states. Overseas migrants do serve to keep the population younger (with most migrants aged in their 20s), but SA's average age is 40 years (2 years older than Australia) and in Regional SA (outside Adelaide), which gets far less overseas migration, it is 45. Because of the older population, SA also has the highest proportion of females of any state, at 50.7% of the population. (This is mainly due to an imbalance in Adelaide: due to the mining industry, Regional SA actually has slightly more males.)
This is regional South Australia's age structure compared to Australia at the 2016 Census.
Because of this older age structure, South Australia overall has a relatively low rate of natural increase (the rate of population change based on births and deaths). For the 6 months ended December 2020, South Australia had a natural increase of 2,375 people. This rate has been very consistent for many years, around 5,000 p.a. This should be just enough to offset the current rate of overseas migration loss, leaving a flat population. But there is one other component of change which we haven't considered: interstate migration.
Interstate migration is changing
Typically in South Australia, interstate migration shows a net loss: more people move out of the state than move in. The notable exception goes back to 1975, when the state took in a lot of people left homeless in Darwin after Cyclone Tracy.
Looking at the latest 6 months, though, you can see that SA is showing a small interstate migration gain. Less people are leaving the state, and more are coming in, for (if it continues the whole financial year) the first interstate gain in 30 years! It's not huge, but interstate migration normally represents a drag on population growth, which is now reversed. This factor alone is why SA's population grew slightly in 2020, while some other states declined. The question is, will it continue?
With SA being relatively open, there is less attraction to travel to other states. Typically, movement has been to Victoria and Queensland. While migration to Queensland has continued, movement out to Victoria – in lockdown for much of the second half of 2020 and three times since – has declined. At the same time, movement to SA from Vic has increased a little, for a net gain. This accounts for most of the difference between the two years.
Internal migration growth is happening outside Adelaide
We also have migration data to December 2020 for parts of state - but only for Adelaide and Regional SA as a total. This is interesting though, as it shows a clear regional trend!
This clearly shows that net migration losses to Adelaide are still there up to December 2020 (albeit lower than in previous years)– it's actually the regional areas of SA which have turned around the state's migration story. Less people are leaving Adelaide, but those who are leaving are more likely to be moving within their own state, bumping up the numbers for the regional areas. Regional SA's net migration has been positive for the past 4 quarters – a combination of less people leaving regional areas (a trend we see across Australia at the moment) and a little more movement in from the city.
Regional SA gets very little overseas migration, so it will be less affected than Adelaide by that downturn. It's quite likely that the 2020–21 data will show a small population decline for Greater Adelaide and population growth matching or exceeding previous years for Regional SA. Unfortunately we don't have this information yet. Next March we get an update on local populations, so we'll be able to see whether this growth is accounted for by just one regional centre (e.g. it could be all in a seachange destination such as Victor Harbor) or is spread around the state, perhaps including places such as Whyalla, Port Augusta and Mount Gambier.
More insights to come
You can explore many of the details of South Australia's population via our Australian Community Profile (including an Adelaide and Regional split). We also work with many individual LGAs in South Australia, and regional areas largely via the Regional Development Australia (RDA) organisations. 66 of the 72 LGAs in SA subscribe to their own dedicated Community Profile or are covered by a regional organisation's profile. You can browse all the LGAs and regions with Community Profiles here.
We are waiting for the results of the 2021 Census, which will be released mid-next year, to see the impact of all these demographic changes on local communities. This will be reflected in all our community profile sites as soon as possible after data release, expected in June 2022.
Any queries about South Australia don't hesitate to contact us: demographics@id.com.au
Glenn Capuano - Census Expert
Glenn is our resident Census expert. After ten years working at the ABS, Glenn's deep knowledge of the Census has been a crucial input in the development of our community profiles. These tools help everyday people uncover the rich and important stories about our communities that are often hidden deep in the Census data. Glenn is also our most prolific blogger - if you're reading this, you've just finished reading one of his blogs. Take a quick look at the front page of our blog and you'll no doubt find more of Glenn's latest work. As a client manager, Glenn travels the country giving sought-after briefings to councils and communities (these are also great opportunities for Glenn to tend to his rankings in Geolocation games such as Munzee and Geocaching).


