Broadcasting to hard-to-reach communities in New Zealand
With newly-updated 2018 Census data now available in our New Zealand Community profiles and Social atlas tools, Territorial Authorities in New Zealand have an opportunity to use up-to-date information about the demographic composition of the community when planning important communications about Covid-19.
With Melbourne’s recent challenges fresh in his mind, Nenad shares some practical examples of how councils in New Zealand can use an informed understanding of what languages are spoken, the technology communities have access to, and the spatial distribution of different demographic groups to make these important public communications locally-appropriate.
For 102 days, New Zealand’s Covid-free society was a beacon of hope to many. For us here in Melbourne, we looked to New Zealand as a possibility to how we might look in a few months’ time if the lockdowns and measures taken to stop the exponential spread of the virus worked. Unfortunately, an unscheduled late-night broadcast by Prime Minister Ardern to the nation last week revealed that Covid-19 was back in New Zealand and spreading within the community.
The government had to act quickly and decisively in order to contain community spread and make sure that any restrictions placed on the population and the economy strike a balance between stopping the virus but not completely crippling New Zealand’s economy. The Covid-free haven quickly became a reminder of Tomas Pueyo’s “ The Hammer and the Dance” cycle we may need to get used to for a while: hammering the virus spread with lockdowns followed by cautious living with the virus as the “dance”.
A mass broadcast message sent to most of New Zealand residents soon after the government announced new community transmission of Covid-19 in New Zealand
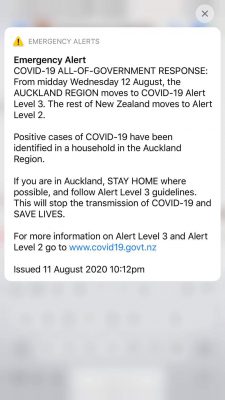
Councils may play a role in communicating with residents or reiterating central government directives. In these early stages of community transmission suppression, broadcasting messages to all parts of our society is important. Speed and breadth of action helps restrict the spread of Covid-19.
Melburnians may recall there being problems with reaching non-English speaking residents with instructions on social distancing and suggested movement restrictions. The communication approach taken was not nuanced or flexible enough and some segments of society were left in the dark or confused. I discussed the importance of broadcasting to hard-to-reach communities in this blog and while much of the advice given in that article and instructional video can be applied to our New Zealand Community Profile and Social Atlas users, I thought it’d be of value to give some tips on how using your .id tools with recently updated Census 2018 data can help councils plan for Covid-19 comms strategies. I have used Wellington City as the example here but as yet (touch wood), Wellington has no cases of Covid-19 and let’s hope it stays that way.
Speaking the right languages in the right places
Understanding which languages you may need to broadcast your message in can be a very effective way of reaching non-English speaking communities. Understanding where some languages are more prevalent than others can fine-tune the reach of important messages and directives.
By assessing the “Languages spoken” page on the Wellington City community profile, we can see that messages broadcasted in English could, in theory, be understood by most (96%) of the population. However, recently published Census 2018 information tells us that over 19,000 Wellingtonians also speak French, Māori, Northern Chinese and German as the other languages to round off the top five, so directing some messages in these languages would be advised. If council doesn’t already have established relationships with some of the communities who speak these languages, this Census information could guide where that closer working relationship may be needed.
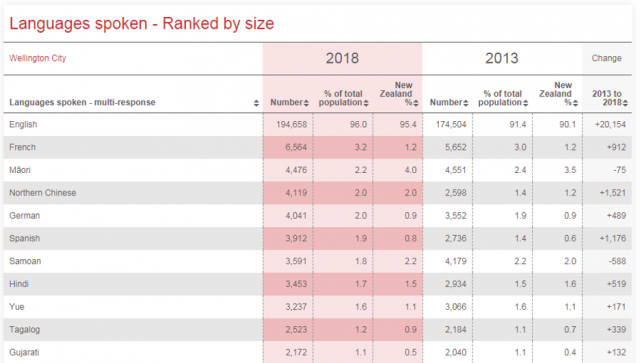
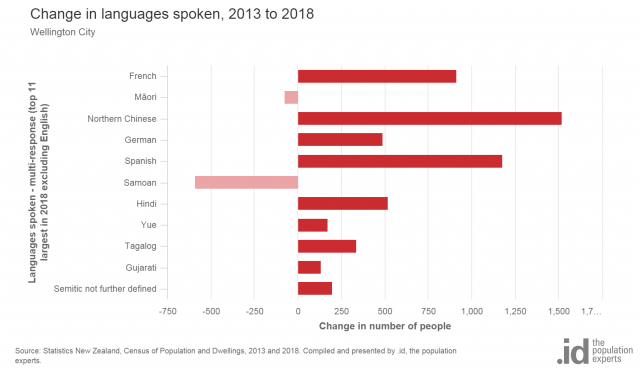
At a City level or suburb (SA2) level, we can identify what has changed since 2013 in terms of languages spoken. While council decision-makers may be familiar with non-English languages spoken in their TA, some things might have changed since the last Census. Further down on the “Languages spoken” page, we see the changes in number of people or proportion of population speaking non-English languages. Since 2013, Northern Chinese has increased by 1,521 residents (+0.7% of the population), followed by an increase in Spanish (+1,176, or +0.5%) but the number of residents speaking Samoan and Māori has decreased.
As a council, are we aware of these shifts? Are we prepared and able to communicate to residents who speak these or other emerging languages? Because large scale Covid-19 spread can start in small groups, it’s not just important to understand the largest changes in languages spoken. Knowing that we, for example, have almost 275 more Tagalog speakers needs to be taken into consideration too. We have information on 113 different languages for Wellington City.
A spatial view
Understanding spatial diversity is also important in this targeted communication approach. Our Social Atlas tool is created with geographic analysis in mind and enables users to understand the spatial diversity of demographics and socioeconomic characteristics. If we explore the geographic spread of people who spoke Samoan and Māori, the data at City level tells us that the number of people who speak these languages is decreasing.
At the small area/suburb level, on the other hand, we can identify areas where communicating in Samoan or Māori is still vital and even increasing. Crofton Downs, parts of Johnsonville and Khandallah, for example, have experienced increases in people who speak Māori and parts of Tawa, Rongotai-Lyall Bay and a few other pockets on the Miramar Peninsula have increased in terms of number and proportion of residents who speak Samoan, therefore, communication strategies in these areas still need the inclusion of these languages.
We are currently in the process of updating the New Zealand “Social Atlas” tool with 2018 Census data. This tool is perfect for this kind of spatial analysis of demographic change. To be notified of these changes as they are made, bookmark our New data and features page (you can also sign up to alerts on the page), and we will keep our New Zealand subscribers posted about the updating of the Social Atlas with 2018 Census data.
Choosing the most effective communication methods
Along with speaking the right language in the right part of town, councils also need to be aware that as efficient and cost-effective as it may be, communicating via the internet may not reach everyone. As we found out early in the escalation of Melbourne’s second Covid-19 outbreak, many government agencies published messaging online, which was not a targeted approach when wanting to communicate with hard-to-reach communities.
It was actually many of those non-English speaking communities who also fell into this group and interestingly it wasn’t that internet-published messages weren’t reaching non-English speakers, but the messages were not arriving via their language or via their online networks, groups and communities often used by these ethnic groups. This is where council relationships with different ethnic groups and communities become quite vital.
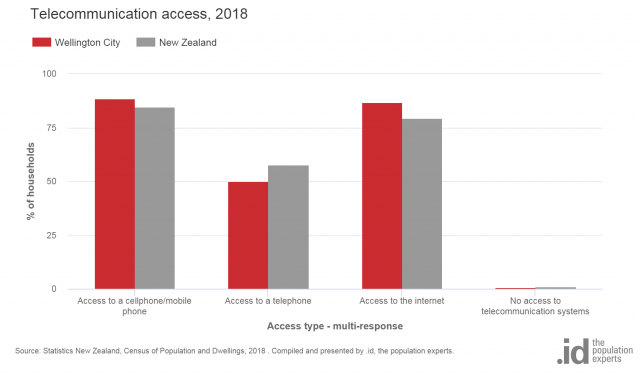
In Wellington City, almost 87% of households had access to the internet and almost 90% had access to a mobile phone in 2018. Both these percentages are higher than that for New Zealand as a whole, not surprising given that Wellington is an urban environment with sufficient communication infrastructure and a predominantly younger, connected population. Unsurprisingly, the number of households with access to a telephone (landline) decreased dramatically (by almost 30%, that is – over 18,000 households) since 2013 so any efforts to invest in mass broadcasts using this method would not be advised.
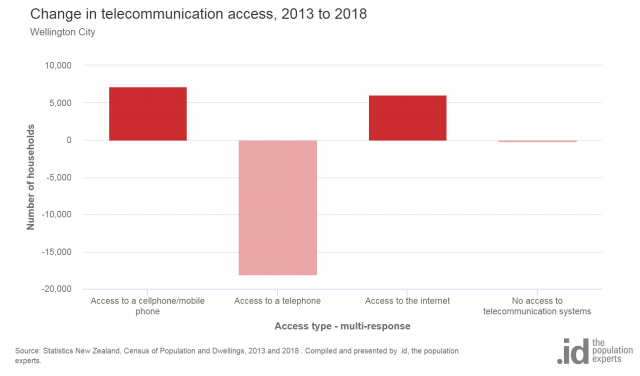
Council communications and local/regional civil defence communication efforts would therefore be best off using mass broadcast cellphone messages (as was done across New Zealand less than 30 minutes after the announcement of Covid-19’s return last week) and internet communication via adverts, videos, instructional infographics and banners.
In areas such as Berhampore, Dixon Street or Kilbirnie Central/Kilbirnie East, where cellphone and internet access was notably lower the City benchmark, the council and other agencies involved may need to look at alternatives to the cellphone/internet method such as door knocking or pamphlet drop-offs to ensure that everyone receives the important messages around the Covid-19 response.
Expanding the localised approach to communication
I mentioned that understanding your City as a whole has value but understanding the differences within the City is even more useful. Using the Social Atlas tool, you can plan your communication efforts, understand where English is not spoken as broadly, which languages are more prevalent in what parts of the City and what kind of communication method would be most effective. By identifying nuances and gaps, you can look for alternatives in the mission to quickly reach a large audience with important messages.
Along with the ideas and information mentioned here, other access-related information worth considering is understanding disability and age of residents across the City – where may access to (potential) testing stations be problematic for some residents and what can authorities do to mitigate this? Outside of our tools, we can create custom datasets for you by cross-tabulating Census 2018 data if you have specific needs such as:
- knowing where older residents who live alone and have no internet access are,
- understanding recent arrivals by country of origin or
- learning more about the age structure of speakers of particular languages.
This kind of information will guide your planned approaches to make sure you are employing the best methods in order to communicate with a group in your community effectively. For support finding and applying these insights in your area, or for more in-depth insights like those listed above, you can contact our team via our demographic consulting page.
Nenad - demographic consultant
Nenad’s background is in geosciences and geographic information systems. At .id, Nenad has experience as both as a demographer and population forecaster. His areas of expertise are place-based analysis, identifying spatial patterns in demographic trends, community profiling, catchment analysis and an understanding of role and function of different communities.