Data from the 2013 Census for New Zealand is starting to roll out of Stats NZ (the kiwi ABS). This blog is for our Australian readers with an interest in New Zealand. It’s a quick update of recently released information on usual resident population (URP) counts.
In explanation for those less statistically inclined, the URP count is different from the annual estimated resident population (ERP) count as it does not adjust for residents temporarily overseas during the census or people missed by the census. Hence the URP count is lower than ERP figures.
New Zealand’s 2013 URP count was 4,242,048 – a tick under the population count of Queensland (4,332,732) in the 2011 census – and it registered a 5.3% increase on the 2006 Census.
While time series comparisons have to be carefully because of the seven period between the 2006 and 2013 NZ censuses (the result of the Christchurch earthquakes disrupting the census schedule, requiring it to be delayed for 2 years). Essentially the changes identified over the seven-year period between censuses may be greater than those revealed in the usual five-year interval between censuses.
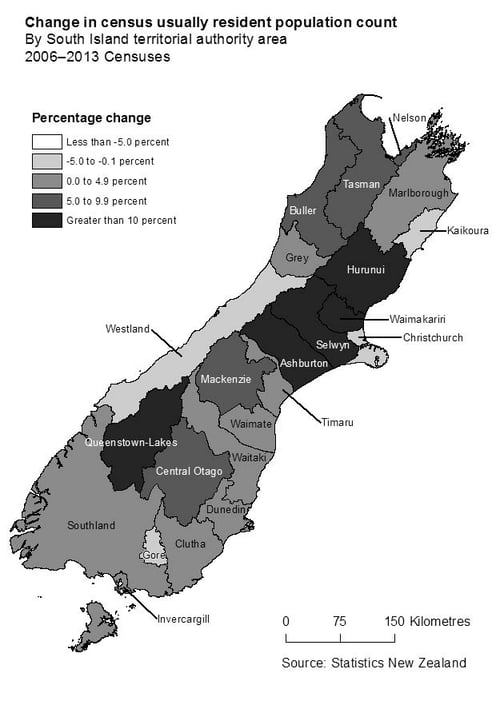
The influence of the Christchurch earthquakes was prominent with half the top ten NZ growth areas coming from the Canterbury area. Christchurch City itself registered a 2% decrease in population.
Conversely, Auckland continued its bullish growth, confirmed as the fastest growing region with a population increase of 8.5% between censuses. However, all regions with the exception of Gisborne registered growth, and Gisborne’s decrease was very small.
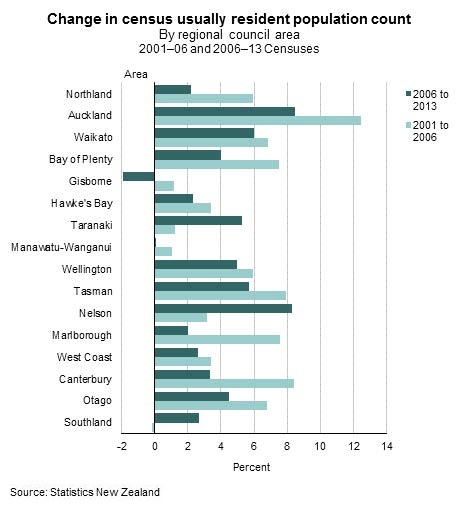
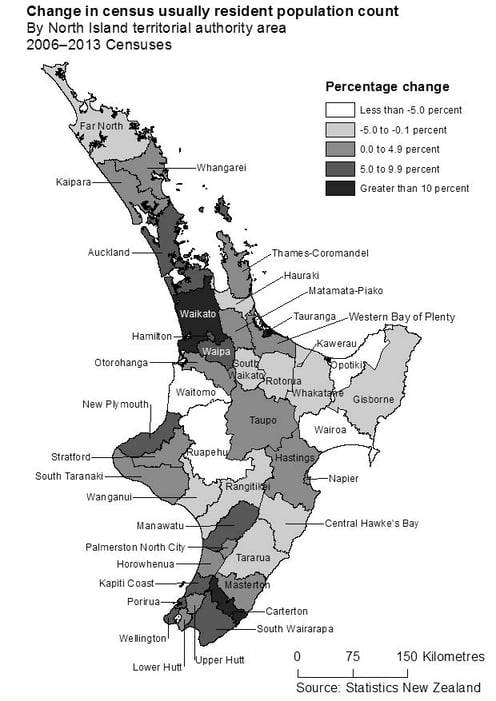
However, the regional figures disguise the change that is evident at Territorial Authority level, where 30% experienced a decline in population (that is 20 out of 67 councils).
The following map presents a snap shot of the population changes.
Find out more out the populations and demographics of New Zealand and Australia via our online demographic resource centre!


