Do mortgage repayments drop with the cash rate?
Following last week’s cut to the Reserve Bank’s cash rate, Glenn shares what the Census tells us about the relationship between a cut in interest rates and mortgage repayments.
If you need to better understand the relationship between incomes and house prices in your area, you may like to learn more about housing.id – our new tool for understanding housing supply, demand and affordability in your local government area.
Last Tuesday, The Reserve Bank cut official cash rates to 1.0% – the lowest on record, following a cut in June.
They had sat at 1.5% for a long time. And for Census watchers like me, it’s particularly interesting, because the Reserve Bank had left interest rates on hold prior to that, for almost 3 years. In fact, the last cut in interest rates before the current set was in August 2016 – the month of the last Census.
This followed a precipitous drop between 2011 and 2016. In fact, every move the RBA has made since 2010 has been a cut – we haven’t seen a rise in official interest rates since then (the banks tend to do their own thing sometimes though and they may have raised rates independently on some loans).
This chart, courtesy of the RBA itself, shows the change in the cash rate over the last 30 years (does anyone remember 17.5% in 1990?!!)
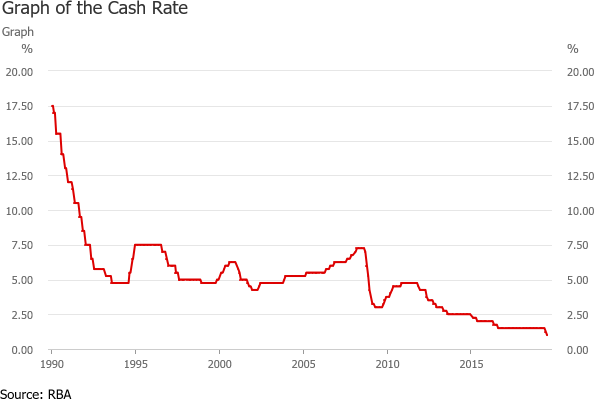
The period which ended in June was the longest period with interest rates on hold on this chart. But before that, we had the 5-year Census period from 2011 to 2016, when interest rates fell – the cash rate declining from 4.75% to 1.5% over 3 years – a 3.25% reduction. Now I know the banks didn’t pass on all of this, but home loan rates were much lower in 2016 than they were in 2011.
The Census records how much people pay on their mortgage – we show this in all of our community profiles. The interesting thing is that from 2011 to 2016, mortgage repayments were almost the same, across Australia – showing only a very minor decline in some places and small increases in others. Nationally, monthly mortgage payments declined from $1,800 to $1,755 per week.
This is a table by state I first published in 2017 in this article.
Mortgage repayments, by State – 2011 vs 2016 Census
So if mortgage repayments didn’t go down over this time, there can really be two main reasons for this
- People are paying more for houses: prices certainly went up – so the amount of mortgages for first home buyers has tended to increase over time. But many people upgrade, or are paying off an older mortgage so their mortgage doesn’t go up when their house value goes up. So for the majority of the population, not buying in at the increasing prices, their mortgages should go down, right?
- People continue to pay off a higher amount: (really set at the amount they can afford to pay) and when interest rates fall, they just pay off more of the principal.
I think the reality is probably a combination of the two – prices going up, so people borrowing more at lower interest rates, while existing mortgagors are continuing to pay a larger amount.
In fact, there is evidence for the latter point from the RBA – the following chart confirms that homeowners increased their payment of loan principals between 2011 and 2016. So, while interest payments went down as a share of income, total payments still hovered around 12% of income.

There is plenty of commentary around this – and financial advisors such as Scott Pape are advising people to do just that. He says that people are not taking advantage of low interest rates to pay off their loans sooner. I think, based on the Census numbers (and those from the RBA) above, they are doing exactly that!
It’s worth remembering that the Census records what people actually pay on their mortgage, not their minimum loan repayment or the amount of the loan.
For a while, I thought we might get to the next Census with no change in interest rates, but they have now fallen further. Anyone think they will rise again by August 2021?
Another byproduct of the lower interest rates in 2016 was a slightly lower rate of mortgage stress nationally (as incomes went up in that time). It declined from 10.6% to 9.9% of households from 2011 to 2016. Overall housing stress went up, though, because rental stress increased from 25% to 28% of renting households.
Our new tool, housing.id, helps you look at the level of housing stress in your area, based on new measures related to percentages of median income, adopted by several State Governments. It also tracks interest rates, incomes in your area, building approvals and the type of housing occupied by different households – as well as how many sales and rentals in your area are actually affordable to people at different income levels. See housing.id in action here, or contact our housing team for more information about having this tool made available in your council area (please note, housing.id is currently only available for as a tool for local government. If you’re from the private sector or a not-for-profit, check out our other publicly-available resources here).
Glenn - The Census Expert
Glenn is our resident Census expert. After ten years working at the ABS, Glenn's deep knowledge of the Census has been a crucial input in the development of our community profiles. These tools help everyday people uncover the rich and important stories about our communities that are often hidden deep in the Census data. Glenn is also our most prolific blogger - if you're reading this, you've just finished reading one of his blogs. Take a quick look at the front page of our blog and you'll no doubt find more of Glenn's latest work. As a client manager, Glenn travels the country giving sought-after briefings to councils and communities (these are also great opportunities for Glenn to tend to his rankings in Geolocation games such as Munzee and Geocaching).