Taking a closer look at South Australia’s Indigenous age profile
Background
One of. id’s blog readers recently contacted .id requesting further information regarding the age profile of younger persons across Australia and South Australia and the State’s Indigenous communities. This is an important subject given five of the seven health and education related outcomes in the Closing the Gap Prime Ministers Report (2018) relate to improving outcomes for Indigenous children.
Having recently joined .id from Adelaide I’m familiar with trends in South Australia’s Indigenous and Non-Indigenous population, having undertaken studies examining migration trends and regional growth/development in small areas across South Australia’s regions.
One of the most useful tools a demographer has for understanding an area is an age profile. Given the Indigenous context, examining age structures between Indigenous and Non-Indigenous populations helps to highlight potential barriers, as well as opportunities to better target government policy within specific areas and communities.
South Australia’s population aging faster than the rest of Australia
Looking first at South Australia’s total population by service groups, the populations largest cohorts are middle aged persons i.e. “parents and homebuilders” (35-49 years) and “older workers and pre-retirees” (50-59 years) followed by the “younger workforce” (25-34 years) (see Figure 1).
Relative to national averages South Australia’s population is older containing larger shares of “older workers” (50-59 years), “retirees” (60-69 years) and “elderly” (70+ years). On the other hand, shares of persons aged younger than 50 years – most notably the “young workforce” (25-34 years) are below national averages, favouring large capital cities for work/lifestyle (i.e. Sydney and Melbourne). South Australia’s faster aging population is a long-term trend driven by higher net outflows of younger skilled workers (people in their 20s) relative to other states due to economic factors.
Figure 1
Population shares by service group, Australia and South Australia, all persons, percent, Census 2016
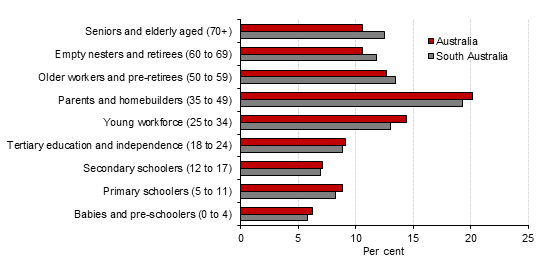
Source: ABS, Census of Population and Housing, 2016.
Australia’s Indigenous population by State and Territory
Looking at the national Indigenous population, the number of Indigenous persons in Australia was 648,947 comprising 2.8 percent of all residents in 2016 (see Table 1) or a small fraction of the total population.
At the state level, approximately 60 per cent of Indigenous Australians lived in two states, New South Wales (216,171 persons | 33.3 per cent) and Queensland (186,484 persons | 28.7 per cent). South Australia’s Indigenous population of 34,190 persons accounted for 5.3 per cent of the national Indigenous population – a relatively small share of the Australian total.
Table 1
Population by state/territory, total persons and Indigenous, number and share, Census 2016
Source: ABS, Census of Population and Housing, 2016.
Note: States and territories may not sum to total.
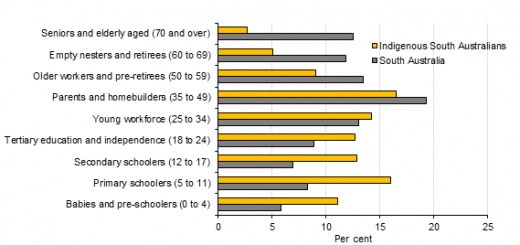
Indigenous South Australians have a younger age profile
A distinguishing feature of the Indigenous population on a state/territory basis is their younger age profile (see Figure 2). Comparing South Australia’s Indigenous age profile with the State’s total, shows 40 per cent of Indigenous persons are aged 0-17 years i.e. are “babies and pre-schoolers” and/or “primary and secondary schoolers”, nearly double the 21 per cent share for the total population. The opposite relationship occurs at the older end of the Indigenous age profile, i.e. shares of Indigenous persons aged 50+ i.e. “older workers”, “retirees” and “elderly” is less than half the share compared with the total population, 17 per cent versus 38 per cent for the total population. Such differences being driven by higher Indigenous total fertility rates (TFR’s) and higher mortality rates compared with the Non-Indigenous population. Consequently, the Indigenous age profile is skewed towards younger age cohorts.
Figure 2
South Australian population shares by service group, total persons and Indigenous, percent, Census 2016
Source: ABS, Census of Population and Housing, 2016.
Over half of South Australia’s Indigenous population lives in Adelaide
The 2016 Census shows a wider geographical distribution in the Indigenous population compared to the Non-Indigenous. In South Australia (a highly urbanised state) 78 per cent of the Non-Indigenous population lived in Greater Adelaide compared with 54 per cent of the Indigenous population (see Table 2). Although the majority of Indigenous persons live in Greater Adelaide, the State’s Indigenous population has a larger regional distribution i.e. a larger share lives in regional centres and/or rural/remote areas relative to Non-Indigenous persons.
Table 2
Greater capital city and rest of state population shares by state/territory, Indigenous and Non-Indigenous, per cent, Census 2016
Source: ABS Cat No. 2071.0, Census of Population and Housing: Reflecting Australia, Stories from the Census, 2016, Aboriginal and Torres Strait Islander Population.
Note: (a) = Excludes Indigenous persons in Other Territories i.e., Norfolk Island, Jervis Bay Territory, the Territory of Christmas Island and the Territory of Cocos (Keeling) Island.
Looking at the State’s Indigenous population according to urban area, approximately half of Indigenous persons lived in the Adelaide urban area. In terms of the distribution of Indigenous persons a decomposition of the population by urban centre size, indicates 15 per cent of Indigenous South Australians live in small urban areas with 10,000 – 19,999 persons as at 2016 (see Table 3). This compares with 6 per cent of the Non-Indigenous population.
Table 3
South Australia’s Indigenous and Non-Indigenous population by urban centre, per cent, Census 2016
Source: ABS Table Builder, Census 2016.
Note: (a) = Excludes Indigenous status not stated and Migratory, Offshore and Shipping.
(b) = boundaries differ to Greater Capital City boundaries.
For younger Indigenous persons aged 0-19 years (children and teenagers) living in urban/rural centres, population distributions were similar to the total population. 51 per cent of younger Indigenous persons lived in the Adelaide major urban area in either “other urban”, “rural” and “other areas” i.e. provincial cities, towns, rural and remote areas (see Table 4).
Table 4
Younger persons in South Australia 0-19 years, Indigenous and Non-Indigenous, number and share, Census 2016
Source: ABS Table Builder, Census 2016.
Note: (a) = Excludes Indigenous status not stated and Migratory, Offshore and Shipping.
(b) = boundaries differ to Greater Capital City boundaries.
Thinking about the bigger picture, raising Indigenous living standards and closing the gap in health and education outcomes is influenced by age structure. Along with other indicators tracking the Indigenous age profile over time provides government with a monitoring tool for assessing changes in health-related outcomes e.g. life expectancy, fertility, etc. While the wider distribution of Indigenous persons across other urban centres outside Adelaide highlights the importance of maintaining/improving access to education services in regional/remote areas.
MARK TREVITHICK
Mark is an economist who joined .id in 2018. Having previously worked at the South Australian Centre for Economic Studies, he is experienced with applied microeconomic research. His work at .id focusses on preparing small area population forecasts for local councils across Australia. Mark has undertaken consulting projects for a number of private and public organisations including South Australian councils, State Government departments, Regional Development Australia and Natural Resource Management Boards. A major focus of his research has been regional development and local governance giving him a detailed understanding of the role, function and changing needs of councils.