Rebecca works in community services delivering adult education and other programs. She wondered if the proliferation of apartments in her area has impacted the mix of local families and how they live and work.
Who are the people living in apartments around here?
Hi .id!
We are a Neighbourhood House in Moreland (Brunswick) and we have noticed a lot of high rises going up in the last two years. We are trying to respond to local needs, primarily through adult education (lifelong learning), and community development, although we do plenty of other things as well, like run events, auspice community groups and run projects.
We were recently informed by council that most people were staying in apartments for only 2-3 years before moving on, which was something we were previously unaware of.
We would be interested to know more about housing, in particular, apartment living in greater Brunswick (Brunswick, Brunswick West, East Brunswick).
We would love to know the age spread of the people moving into apartments, what their employment level is, eg employed/unemployed/part-time/student, what their income level is and what their level of education is. We would also love to know what kind of family (or other) unit they are (eg. with young children, share housing, older and single, etc.)
We are also curious to know if people are working from home or an office in the City of Moreland more generally.
Rebecca
Rebecca sent us this question via our Ask an expert page – if you have a question for our experts, submit it here!
We hear this type of question quite regularly from people working in community services. They need to understand the community they’re serving (particularly their housing type, employment and education, income and their age and stage in life) so they can adapt services to their needs and situation.
Our free demographic maps and profiles are set up to help you do just that. By switching between the topics in each profile, you can build up a story of the people living in the area, and how that is changing.

Communities of interest
Rebecca wants to understand the characteristics of a particular subset of her community (in this case, people living in apartments).
We call these groups Communities of interest (CoIs) and have built special modules in our community profiles where we present detailed cross-tabulated data. The CoI module answers these questions about cohorts such as the Indigenous population, Low-income households, Recent arrivals, Non-English speakers, people Born overseas and those with a Need for assistance.
Unfortunately, there isn’t a Community of Interest for People living in apartments. If there was, this would be a very quick exercise! Instead, we can look at correlations. We’ll look at which part of Moreland has a high number of people living in apartments, and we’ll look at which parts of Moreland has the most transient population, couples with children, and people working from home.
This spatial analysis is made possible by the fact Moreland subscribes to our social atlas tool (atlas.id). This is a double-win for Rebecca. Not only does atlas.id present demographic data on a map (so you can see spatial patterns), but it presents some cross-tabulated data, so you can answer some of those pointier questions about people in apartments. More on that below.
Has there been an increase in the number of apartments in Brunswick?
Answer this question: Open your community profile > How do we live? > Dwelling type

Rebecca is right – there absolutely has been.
You can see the change in dwelling stock in Brunswick on the Moreland community profile under How do we live > Dwelling stock.
This chart shows the radical shift of Brunswick over the past 10 years from predominantly separate houses and terraces into higher density blocks of units.
On that page, you can see Brunswick also has a particularly high share of high-density dwellings, compared to the entire City of Moreland.
Our social atlas for Moreland shows on a map how high-density dwellings are distributed throughout the council area (mostly around Brunswick and Brunswick East, with a smattering around Coburg and Brunswick West).
Are people staying in the area for a few years, then moving on?
Answer this question:
- Open your community profile> Migration profile > Migration summary
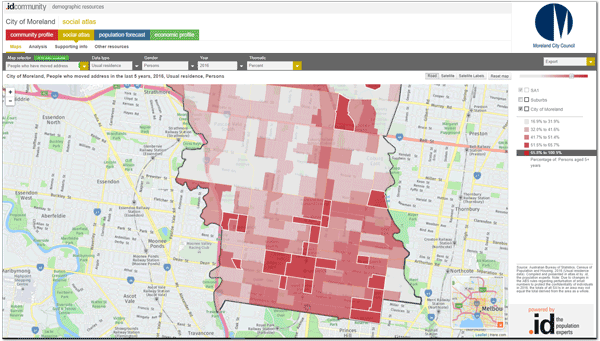
- Open your social atlas > Map selector > Population > People who have moved address
Population mobility is an interesting one.
The Migration summary on the Moreland community profile looks at Moreland overall, showing how many people move around between each Census.
For the council area in total, around 43% of people moved over the past 5 years, which is only a little above the Australian average of 40%.
But, the analysis tab on Moreland’s social atlas (note, you have to select the analysis tab when you open that link) confirms what the council have told you – Brunswick is quite different, and do have quite a transient population. In Brunswick and Brunswick East, we see the highest proportion of people moving over a 5 year period, at 56-57%.
The LGA’s total figure is reduced by the inclusion of places like Fawkner and Hadfield, with a lot of older migrants from Italy, who have lived in the area for a long time. This shows the importance of zooming in to look at data at the suburb level, which you can do in most parts of profile.id and atlas.id.
Certainly, looking at the atlas map of people who moved, there is a strong correlation with the location of high-density dwellings:
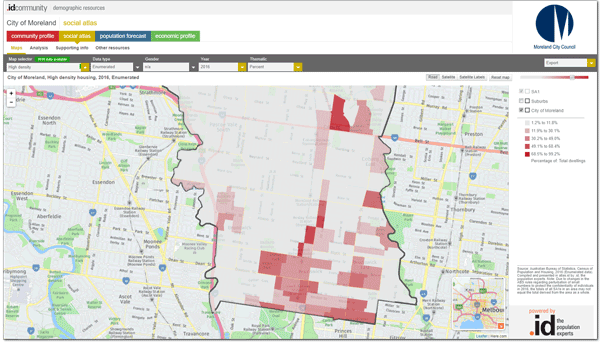
City of Moreland – High-density housing (2016)
Even more than high density, population movement is associated with renters.
Homeowners are more likely to stay put over longer periods, partly due to the high cost of moving (stamp duty etc). Renters don’t have these costs, and are generally more mobile. They are also younger, and people move more when they are young. Of course, flats and units are more likely to be rented than separate houses generally, so this is another part of the story.
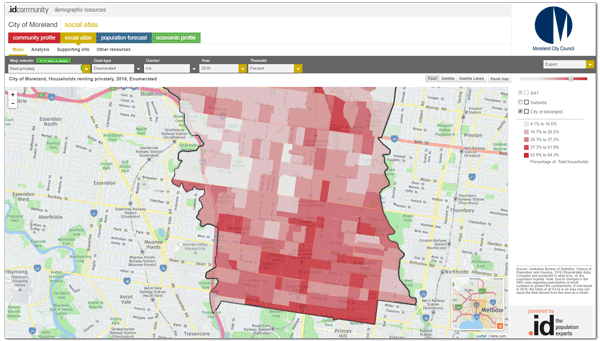
City of Moreland – Households renting privately (2016)
So quite a lot can be done with profile.id and atlas.id in terms of correlating key trends in a given area.
Characteristics of people in high-density dwellings
So you know there has been a significant increase in the number of apartments in the Brunswick/Brunswick East area. You know that area also has a relatively transient population. So where are the families living?
These remaining questions are very specific to the characteristics of people who live in the higher density dwellings – employment, family types, etc. As I mentioned above, these would be ideally answered by a Communities of Interest module, where ‘apartment dwellers’ would be the community of interest. As that particular module doesn’t exist currently, here’s how you can still answer that question;
Head back to the social atlas for Moreland, where you can see that Couples with Children households are at quite low levels in the same areas that have lots of renters and higher density housing. You can browse other household types (see menu items below, including one parent families, young couples without children, etc.) to answer the question ‘who are the people living in these apartments?‘.
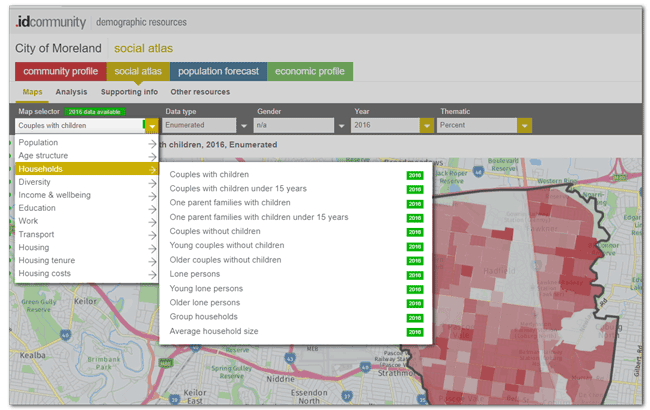
Using Communities of Interest – backwards!
Rebecca, we include this part for readers in other council areas who may subscribe to our Communities of Interest modules.
If your council subscribed to a CoI for a certain cultural group, age group, people with a disability, or low-income households, you could look at the Households and housing menu in that module to learn more about the household patters for that group. For instance, are low-income households more or less likely to live in higher density? Which cultural groups favour higher density housing?
The City of Moreland don’t currently subscribe to our Communities of Interest module, but if you look at a council which does (for example the City of Stonnington), you can see a lot of interesting information about population groups in that area. For instance, 18-24 year olds, and people speaking Chinese are far more likely to live in high-density housing in Stonnington than the total population.
Generally, higher density housing is occupied by younger people. This chart is from some work we did from the 2011 Census, but it shows the clear peak for people in their 20s in Melbourne who are much more likely to live in high density (3+ storey blocks of flats) than any other age group. It increases a bit towards the elderly, but mostly it’s young people.

Are there people working from home?
Your final question was about work locations. Moreland does subscribe to our economic profile (economy.id), which looks at the characteristics of workers and where they go to and from to work.
This chart shows that of the nearly 40,000 people who work in Moreland, 37% lived in Moreland, while the remaining 63% live outside, mostly coming from Hume, Darebin and Whittlesea.
On the other hand, of those who live in Moreland (over 80,000 employed residents), 78% leave Moreland to work, with the City of Melbourne accounting for just over 1/3rd of employed residents.
Our Community Profile shows that only 3.5% of those employed residents worked at home on Census day, (slightly higher at 4.1% and 4.8% in the apartment hotspots of Brunswick and Brunswick East) while the social atlas shows that just 2% worked at home in their own business, which is lower than the Melbourne average (we found that figure in the Moreland social atlas>Map selector> Transport>Worked at home in a home-based business>analysis tab).
We hope that helps answer your question Rebecca – these are exactly the sort of questions our tools are designed to answer. We also hope this post helps others in community services better understand the communities they’re serving!
Do you have a question you would like to ask our experts?
Submit it here! We know our subscribers work on a variety of interesting projects in a broad range of industries, and every month we choose one question to answer and share, helping others in your situation answer that question for themselves. Get in touch and tell us what you’ve noticed in your area- we would love to hear about what you’re working on!


