The topic of Homelessness is one of the most frequently raised during our briefings to councils and communities across the country.
On March 14th, the ABS released ‘Estimating Homelessness‘. This eagerly anticipated publication comes out once every Census, and provides detailed counts and estimates of the number of people who are homeless or in substandard accommodation in Australia.
This version is from the 2016 Census, and is one of the last datasets to be released from it.
Collecting data on homelessness
Actually, data isn’t just from the Census. The ABS has teams of field interviewers counting homeless people via a special short form on Census night, but these data are supplemented by information from crisis accommodation providers and boarding houses to provide a more robust count. As you can imagine, it’s not easy to get a complete count of the homeless population, so these are estimates from a variety of sources.
At the 2016 Census, there were estimated to be 116,427 people homeless in Australia, an increase from 102,439 in 2011. This represents an increase of 13.7% on 2011, but the rate per capita only increased by 4.6%, to 49.8 people per 10,000 Australia-wide. So much of the increase is just due to Australia’s general population increase.
The breakdown by state is shown below.
HOMELESS POPULATION BY STATE/TERRITORY, 2016
Source: ABS, Estimating Homelessness, 2016 (2049.0)
One number really stands out. While Tasmania recorded the lowest rate of homelessness, the Northern Territory had a rate of more than 10 times the next highest state, New South Wales.
This is largely due to the much higher rate of homelessness among the Aboriginal/Torres Strait Islander population (361 per 10,000 across Australia, but 2,083 per 10,000 in the NT). That means that one in five Aboriginal people in the NT were classified as homeless. But the rate among Non-Indigenous people there was also the highest in the nation, at 84 people per 10,000.
The different types of homelessness
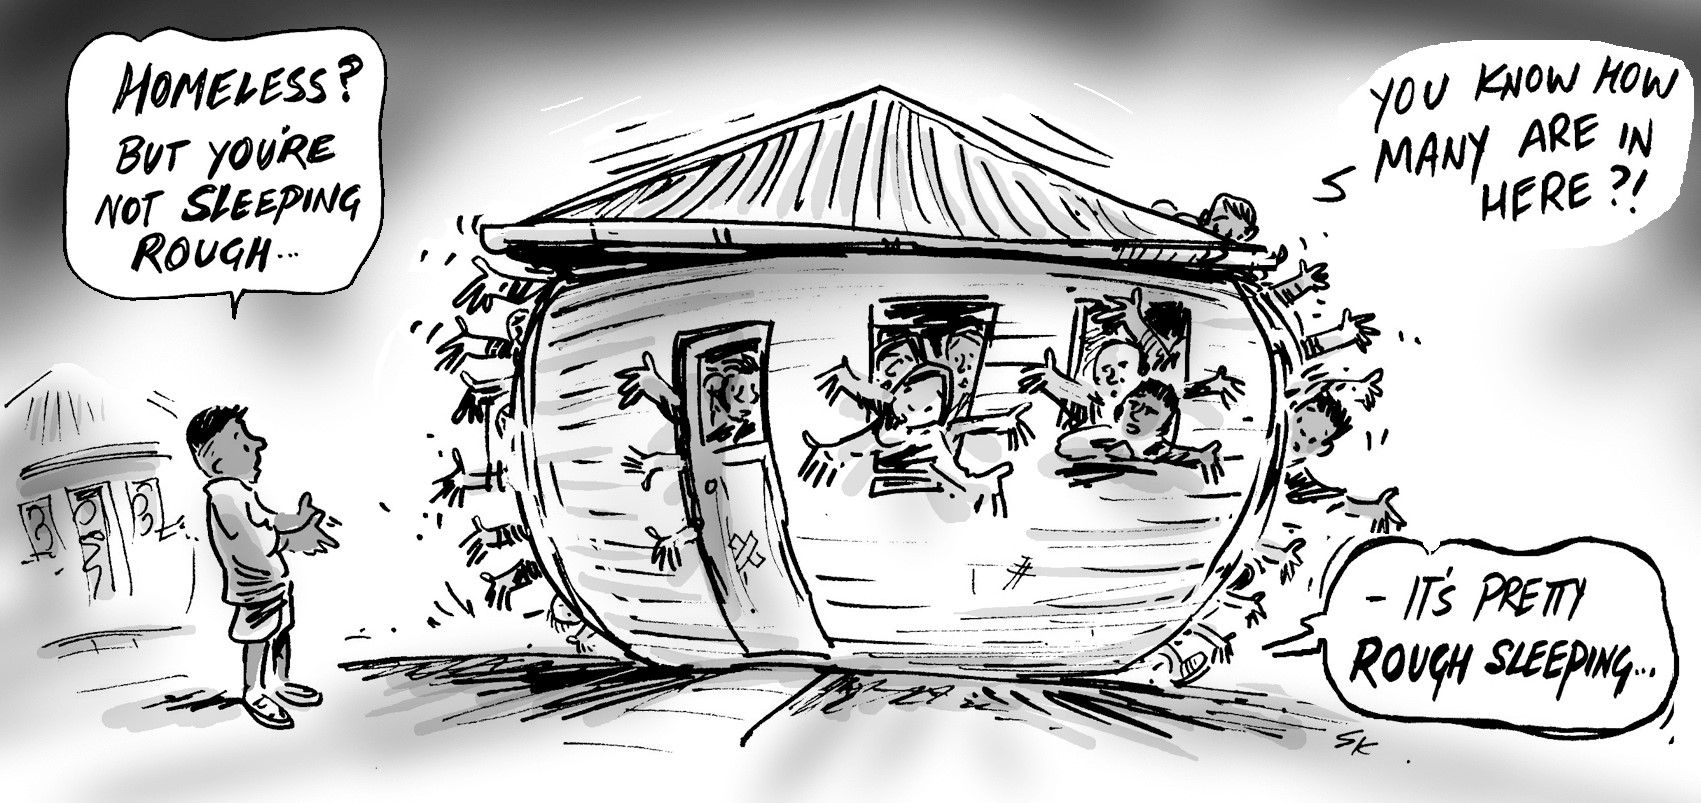
The ABS breaks the homeless population down into 5 “operational groups”. Homelessness does not just include people sleeping rough, under a bridge or on a park bench. This is a common view of homelessness, but this category made up only 7% of all the homeless population (8,200 people) in the 2016 Census.
Other, much larger categories include “Supported accommodation for the homeless”, (which includes crisis centres, domestic violence shelters etc), people staying in boarding houses, staying temporarily with other households but having no usual address (commonly called couch surfing).
Source: ABS, Estimating Homelessness, 2016 (2049.0)
The largest single group, however, accounting for 44% of the homeless population Australia-wide, is people living in “severely crowded” dwellings.
Some may say these are not homeless, since they are living somewhere. However the definition of “severely crowded” is that a dwelling requires 4 or more bedrooms to accommodate its household adequately. Generally, this standard allows 2 people per bedroom (plus some more nuanced criteria around age and sex of children who can share a bedroom). So a dwelling requiring 4 extra bedrooms would be something like a 2 bedroom house accommodating 12 people. That’s pretty crowded!
This is the category which has seen most of the increase between 2011 and 2016. While it’s 44% of homeless across Australia, it’s 80% in the NT – indicating the significant problem with overcrowding in Indigenous communities. However, it actually decreased in the NT, while the biggest increase was in NSW, where it rose from 9,655 in 2011 to 16,821 in 2016, an increase of 74%! This may be an indication of housing unaffordability in NSW.
Characteristics of the homeless population
A few interesting characteristics of the total homeless population in Australia:
- Males made up 58% of the homeless and females 42%. Males outnumbered females in every category, but particularly rough sleepers (66%) and boarding house residents (73%). It was close to even (51%-49%) in supported accommodation for the homeless.
- This sex difference was mainly among the older population. Despite the elderly population in general being skewed towards females, the older homeless population was very male-dominated, with 59% male in the 75+ age range, and 65% aged 65-74. Among young people under 18, homelessness was about 50-50 male-female.
- The highest rate of homelessness was in the 19-24 age range (95 per 10,000), but 16% were aged over 55.
- Aboriginal and Torres Strait Islander people made up 20% of the homeless population Australia-wide (3% of total population).
- All categories of homelessness increased from 2011 to 2016, except for people in supported accommodation for the homelessness, which was largely flat.
In great news for Local Government, the ABS is now publishing homelessness numbers for Local Government Areas, as well as standard larger geographic units. Unfortunately, there’s not a huge amount of information available at the LGA level – only the total homeless population. Many councils rely on local surveys to provide more information on their local homeless population. Nevertheless, it’s great to have some data available at the local level.
The data shows that the Local Government Area with the greatest number of homeless persons in 2016 was in the City of Brisbane (5,813 people). However, it’s worth remembering that Brisbane has a population of over a million – much larger than any other LGA (The City of Sydney had 5,061, and East Arnhem 3,833 – indicative of the high rates in the NT). The next three are all in suburban Western Sydney, Cumberland, Canterbury-Bankstown and Fairfield – all indicative of a growing homelessness issue in that region.
For our Local Government clients – you can download these figures from the publication download page on the ABS website. Would you find it helpful to see homeless population figures directly on your community profile highlights page? Let us know in the comments section below!
.id is a team of population experts who combine online tools and consulting services to help local governments and organisations decide where and when to locate their facilities and services, to meet the needs of changing populations. Access our local government area information tools here.